Types of Performance Tests
Each type of test answers its own question — where the limit is, what happens under a peak, and whether the system can run for days without crashing. In this article, I explain with real examples and graphs how I approach performance testing.
📈
Introduction
💡 Understanding the differences between test types isn’t just theory. It’s the key to interpreting results correctly.
Once, on a banking project, the team mixed up the type of test. They had planned a load test to confirm stability, but the scenario was mistakenly built as a stress test — the load ramped up too quickly and exceeded the expected level.
As a result, the system crashed after just 10 minutes, and the client assumed the application couldn’t handle basic traffic. Only after analysis did it become clear: the problem wasn’t in performance itself, but in the wrong testing methodology.
Each type of performance test answers its own question about the system:
- 🔥 Smoke — does everything even work?
- 🚀 Capacity — where is the performance ceiling, after which degradation starts?
- 📊 Baseline / Load — how does the system behave under stable conditions, and how do metrics change after updates?
- 🕒 Soak / Endurance — what happens if the system runs continuously for hours or days?
- 💥 Stress / Spike — how does it react to peak and extreme conditions?
- 📈 Scalability — does performance grow along with added resources?
- 📦 Volume — how does data volume affect performance?
- 💻 Client-Side — how fast and smooth is the experience for the user?
🧠 This article is based on a discussion and shared reflections with Ivan Zarubin, a performance testing engineer with over 12 years of experience.
We discussed what types of tests exist, why each one matters, and how to use them effectively in real projects.
🔥 Smoke Test — Basic Environment Check
A smoke test is the first and simplest check. Its goal is to make sure that everything actually works — the app opens, login succeeds, scenarios execute correctly, and monitoring shows the expected metrics.
Think of it as a pre-flight diagnostic. Smoke doesn’t measure performance. It simply confirms that the environment, data, and configuration are ready for real testing.
If the smoke test fails, running capacity, load, or soak tests makes no sense — all further results would be misleading.
💡 The purpose of a smoke test isn’t to get numbers. It’s to make sure the system is even ready to respond.
🚀 Capacity Test — Finding the Real System Limit
The goal of a capacity test is to find the upper limit of the system’s capabilities. We gradually increase the load — 10%, 20%, 30%… — until we notice that the response time starts growing faster than usual and errors appear more frequently.
At that moment, the system reaches its capacity point — the stage where it’s already working at the edge of its abilities, and anything beyond that only makes things worse.
A capacity test shows how much headroom remains in the current configuration and where the real bottlenecks begin. It’s valuable not only from a technical perspective but also a business one: by knowing the system’s limits, you can plan scaling in advance, predict behavior under traffic growth, and avoid overpaying for unnecessary resources.
💡 Capacity testing helps you make smart decisions before production forces you to.
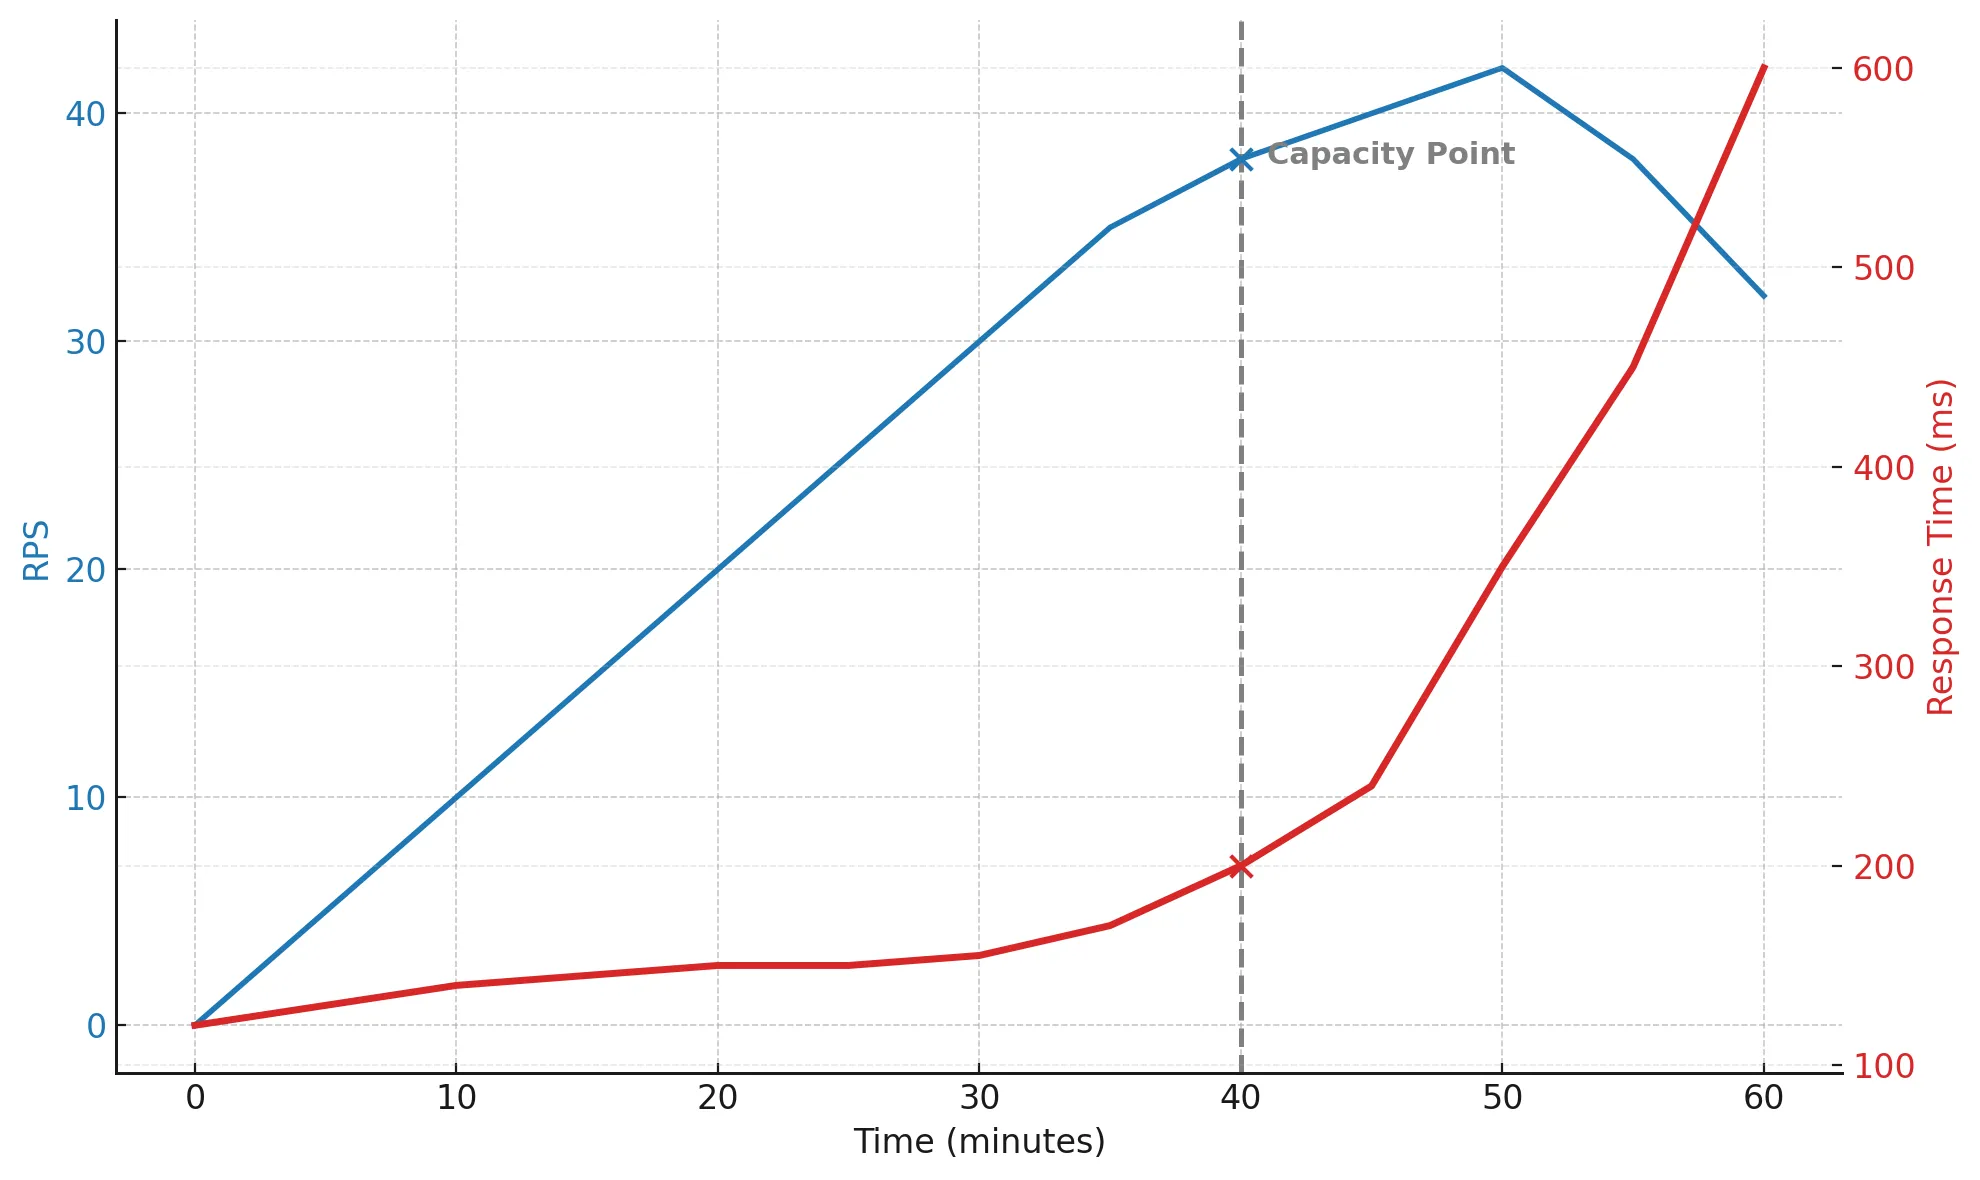
RPS grows and reaches around 40 — that’s the system’s throughput limit. After this point, the real RPS stops increasing, while response time begins to rise sharply.
Requests start to queue, CPU utilization approaches 100%, GC triggers more often, and overall performance starts to degrade. By the 45th minute, the system is clearly struggling, and by the 60th, response time has increased nearly four times.
This kind of graph perfectly illustrates the moment where scalability ends and survival begins.
📊 Baseline / Load Test — Checking System Stability
Baseline and Load are essentially the same scenario, but with different goals. First, you run the baseline to understand how the system behaves under calm, steady conditions — response times, stability, error rate, resource usage. This becomes your reference point, making it easy to compare future results after any changes.
Then the same scenario is used as a load test — run after optimizations, releases, or updates to check whether things improved or at least didn’t get worse.
Typically, the load is kept at 70–85% of capacity, and the system runs under it for 1–2 hours. If the metrics remain stable — with no spikes, leaks, or degradation — it means the system confidently handles production-like load.
💡 Baseline helps define the normal, while Load ensures that normal stays unchanged after updates.
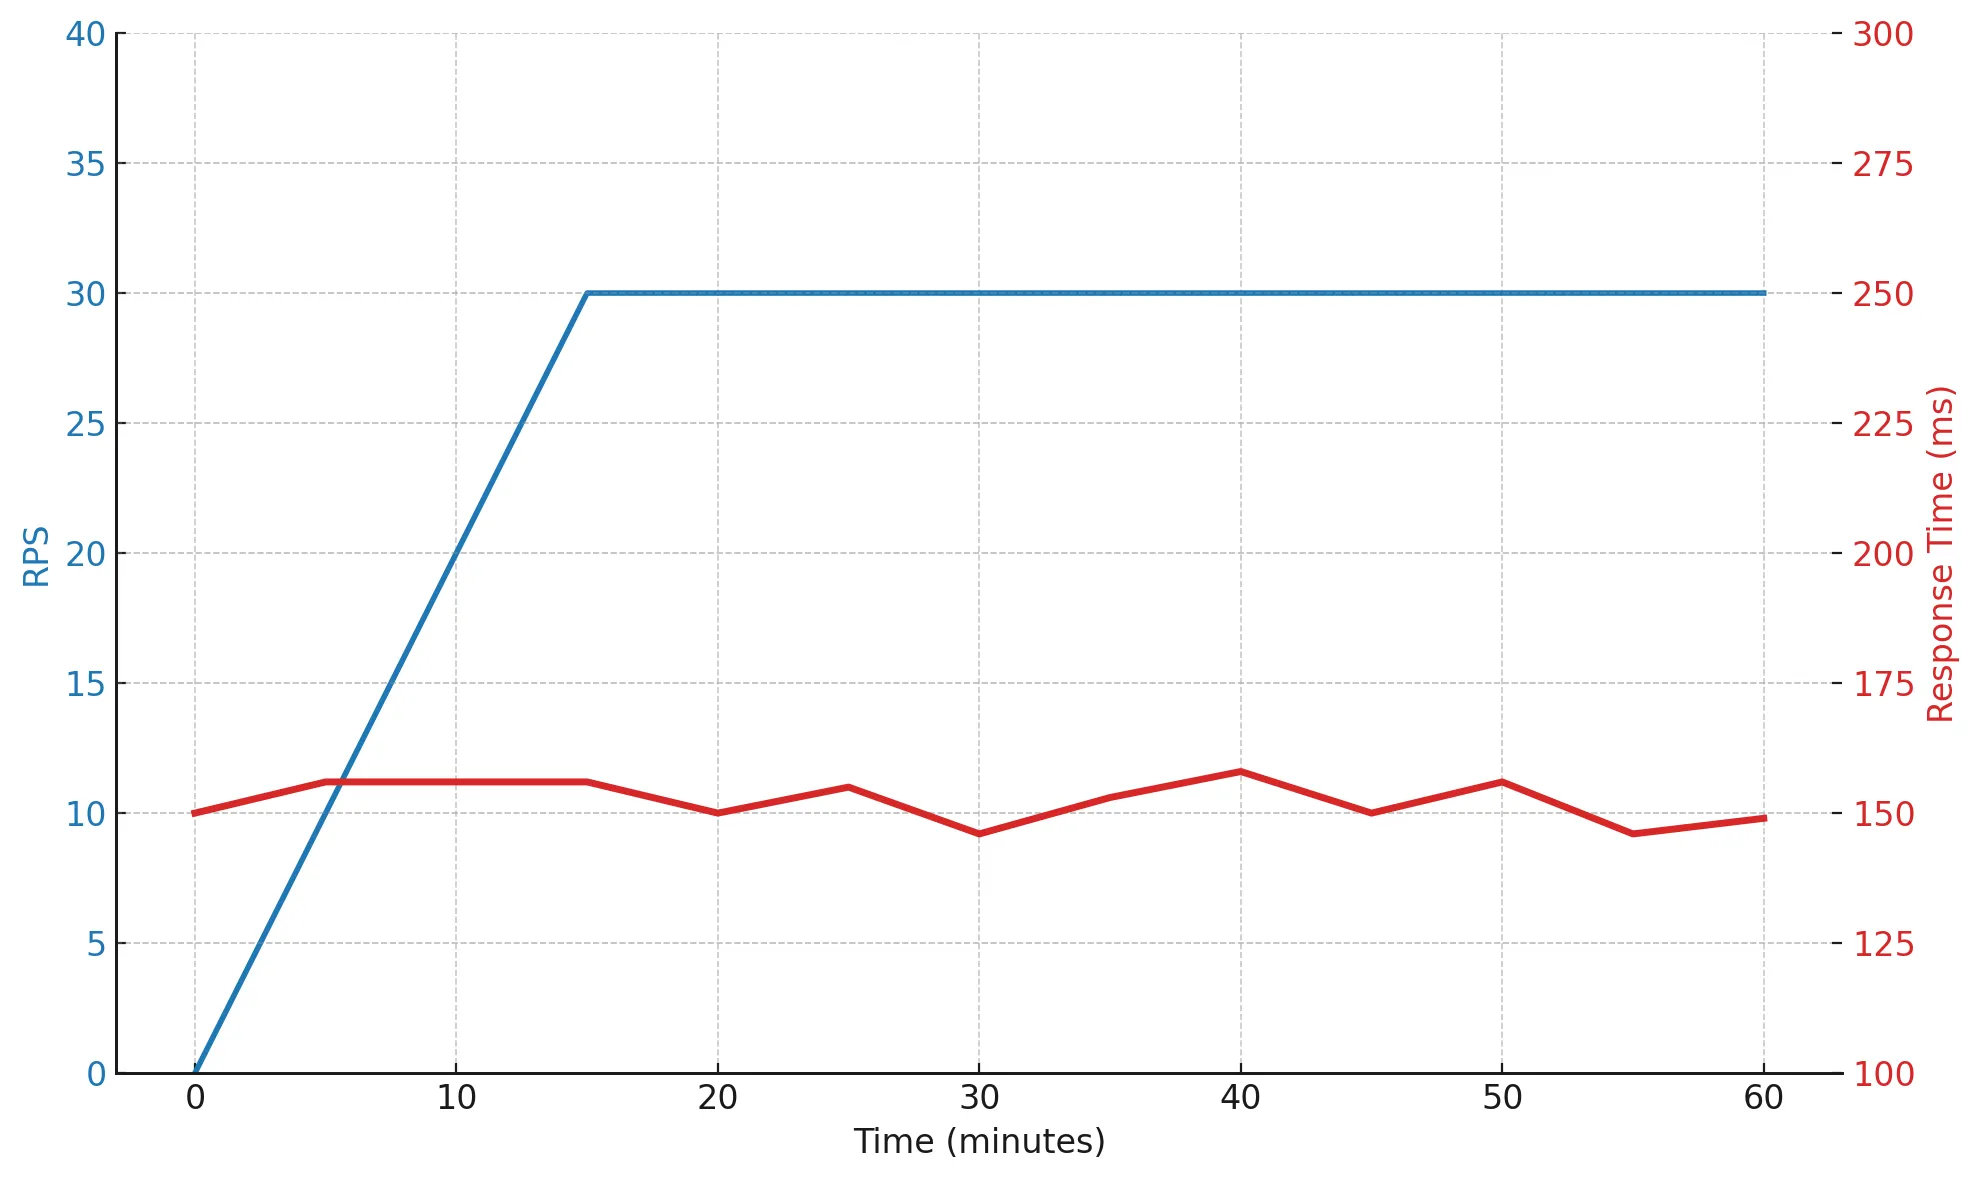
During the test, the load remains constant — around 30 RPS (roughly 75% of capacity), and response time stays within 150–160 ms. This means the system runs smoothly, predictably, and without degradation — a sign of a healthy architecture with a solid performance margin.
🕒 Soak / Endurance Test — Long-Term Reliability
A soak test is an endurance check. Its goal is to understand how the system behaves under a steady load for an extended period — not for an hour, but for 6, 12, or even 24 hours.
While capacity and load show how the system reacts to growing pressure, soak answers a different question: “Can the system handle long, continuous pressure without degrading?”
During this test, the load remains constant, but what matters isn’t the number of requestsю It’s how the metrics change over time. You watch for:
- increases in latency;
- growth in GC time;
- memory consumption creeping up;
- or a rising count of open threads or connections.
If these indicators slowly but steadily increase, it means the system is accumulating issues that will eventually lead to performance degradation.
💡 A soak test helps uncover problems that short tests can’t — slow memory leaks, cumulative effects, and gradual performance decay over time.
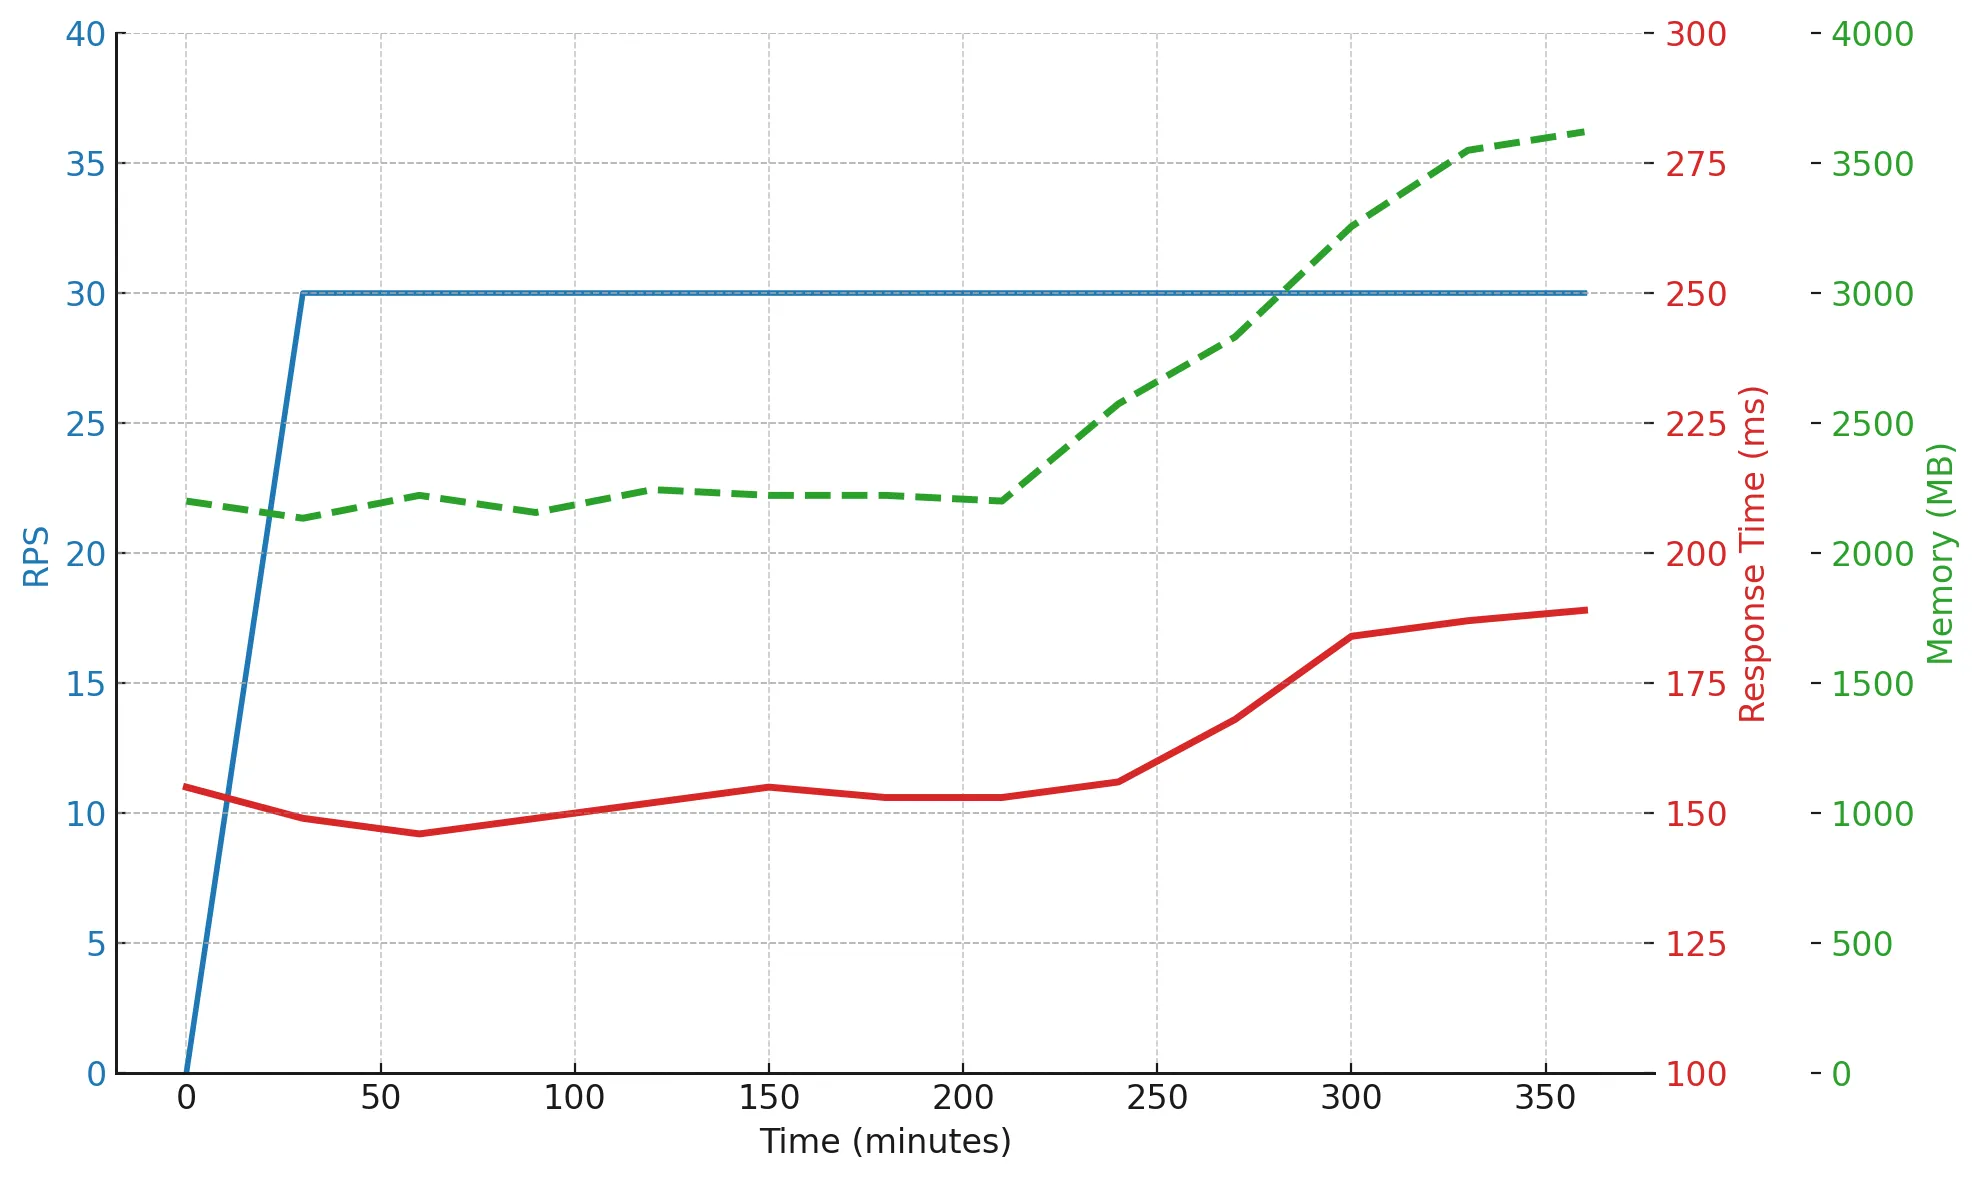
Over six hours, the load stayed stable, but memory usage grew from 2200 MB to 3600 MB — a clear sign of a potential leak or unreleased resources. At the same time, response time stayed within acceptable limits: the system holds up, but it’s starting to show fatigue.
💥 Stress Test — System Behavior Under Critical Conditions
A stress test is a test of resilience. Its purpose is to understand what happens when the load exceeds normal operating limits.
If the capacity test shows where the boundary lies, the stress test answers the question: “What happens when we cross that line?”
This test helps uncover weak spots in the infrastructure, dependency chains, and failure scenarios that remain invisible under regular load. The main goal isn’t just to find the point of degradation. It’s to understand how the system recovers after being overloaded.
🚨 When and why to run a stress test:
- before peak seasons (e.g., big sales or Black Friday);
- before major releases or marketing campaigns;
- after changes to infrastructure or autoscaling logic;
- when testing recovery speed and fault tolerance.
A stress test simulates extreme conditions: sudden user surges, slow integrations, or partial service outages. It reveals whether the system crashes completely, degrades partially, or can recover on its own without manual intervention.
💡 A stress test shows how the system behaves under pressure — what breaks first and how fast it bounces back.
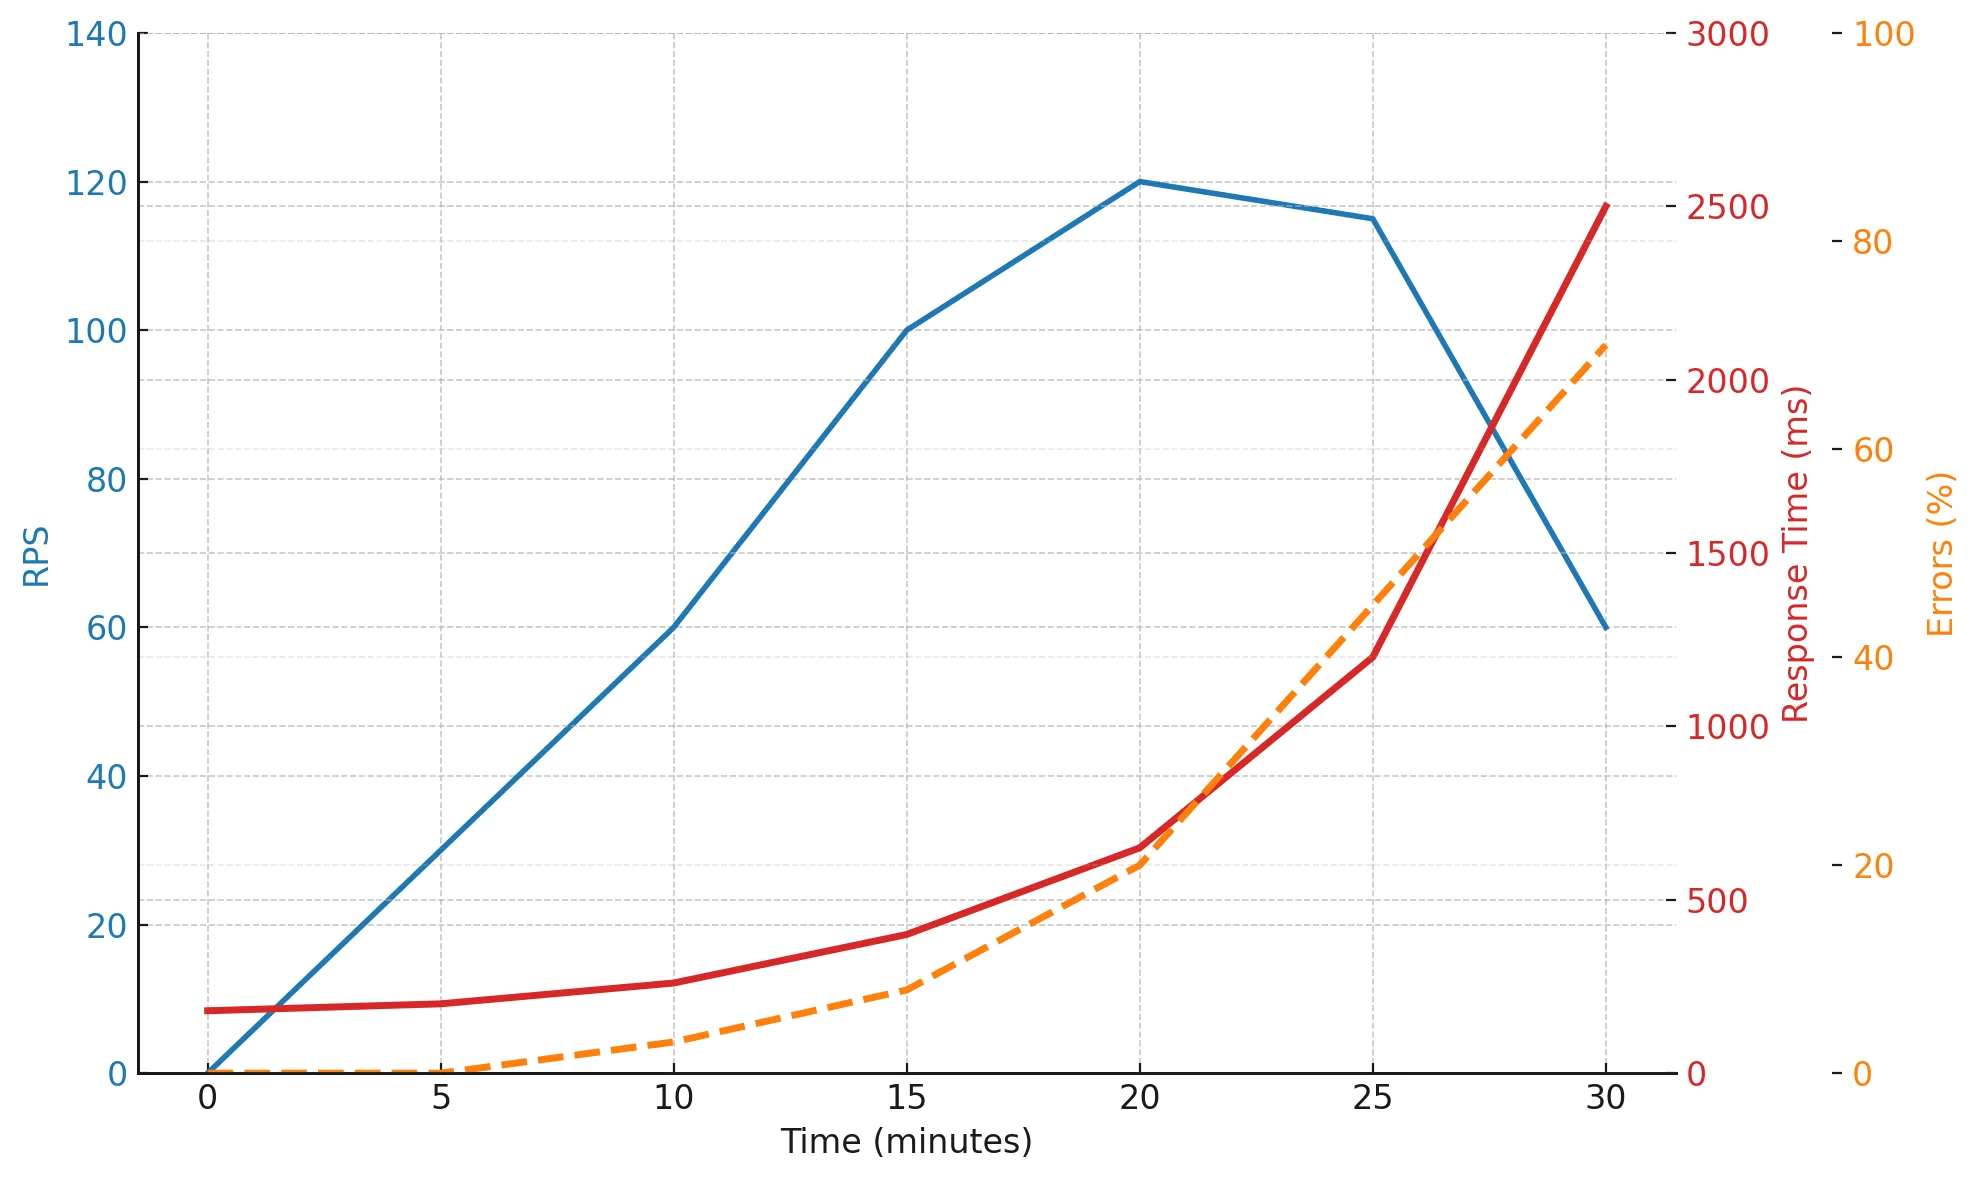
Up to the 20-minute mark, the system maintains stable performance. After crossing its throughput limit, RPS stops increasing — it hits a plateau. Meanwhile, response time rises exponentially, and errors multiply rapidly. By minutes 25–30, the system barely responds correctly — a clear signal of its stability limits.
⚠️ Note: On most projects, stress and spike tests are run infrequently. Teams typically rely on capacity and soak tests, which already provide enough insights for analysis and planning.
⚡️ Spike Test — Resilience to Short-Term Peaks
A spike test checks how the system reacts to sudden, short bursts of traffic. Imagine a marketing campaign launch, a push notification, or a flash sale. Within seconds, thousands of users hit the service simultaneously.
The main question here isn’t “where is the limit?” but how quickly the system adapts and returns to normal. Does it release resources in time? Do connections hang? Do errors start piling up in queues?
⚖️ How it differs from a stress test:
A spike test doesn’t push the system to failure. It’s softer, designed to check elasticity and reaction speed. It’s often paired with stress testing to see how gracefully the system handles rapid but short-lived traffic spikes.
Spike testing helps identify weak spots that aren’t visible under steady load:
- slow caches,
- inefficient autoscaling,
- thread pools that can’t expand fast enough.
💡 A spike test is a great way to ensure your system can survive sudden traffic surges and smoothly return to normal operation.
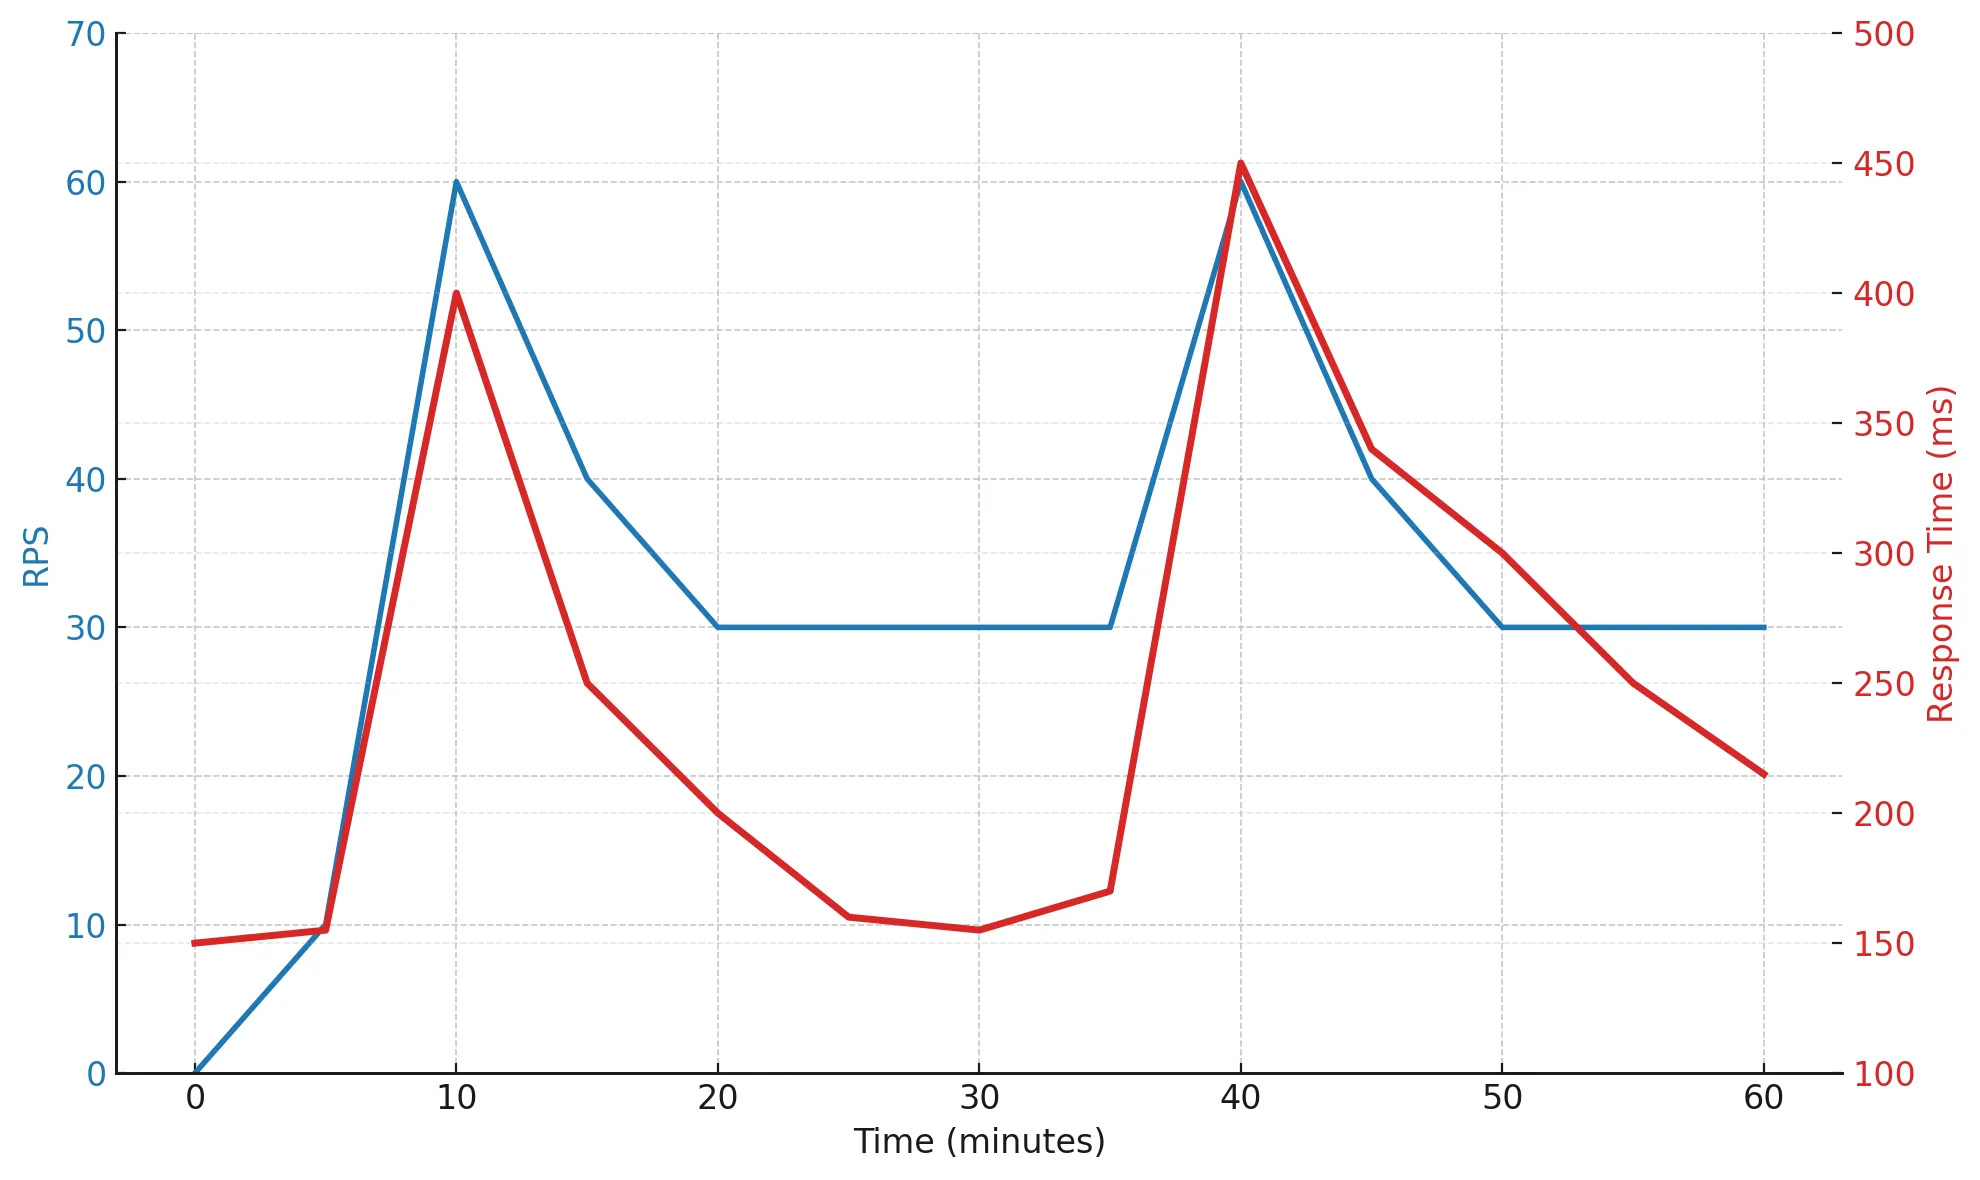
At the 10th and 40th minutes, you can see sharp load spikes — RPS jumps, and response time increases to 400–450 ms, but once the load drops, the system recovers quickly.
This behavior shows that the system has a healthy level of flexibility. It can withstand short, intense peaks without degradation or leaks.
📈 Scalability Test — Scaling Efficiency
A scalability test checks how efficiently a system uses added resources. If we increase the number of servers, pods, or CPUs, will performance grow proportionally, or will it hit architectural limits?
This is especially important in microservice-based systems: different services often depend on each other, and a single bottleneck can nullify the entire scaling effort. Such a test helps reveal where the system stops scaling linearly and how well it handles horizontal expansion.
🚗 Imagine installing a second engine in a car, but both engines drive the same wheels. It won’t go any faster. The same applies here: adding more resources doesn’t always mean better performance if the architecture has hidden constraints. A scalability test helps find and measure those limitations.
💡 A scalability test shows how effectively scaling works and where the architecture needs improvement to make the most out of added resources.
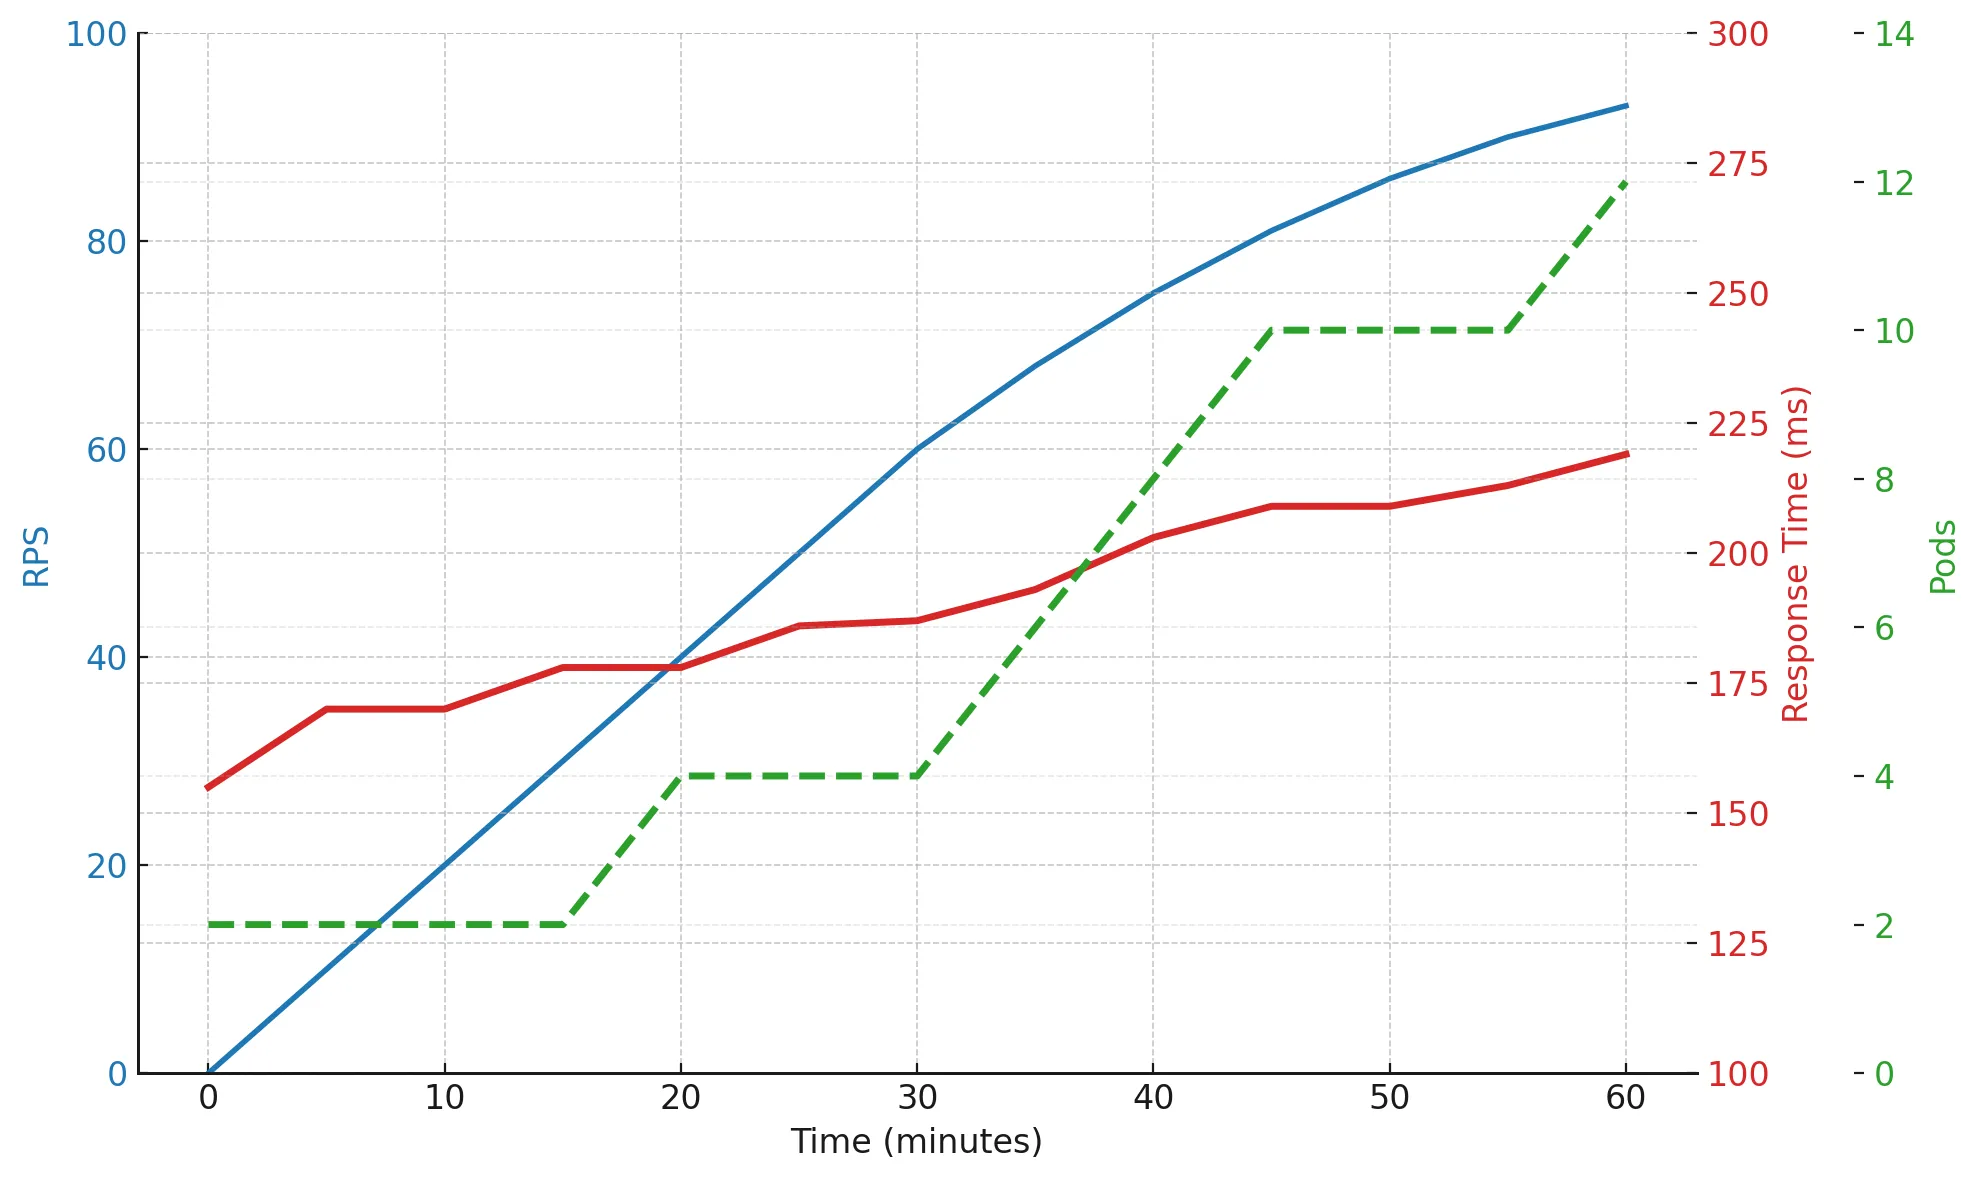
When increasing the number of pods from 2 to 12, RPS grew nearly fivefold, but response time also rose slightly. That’s a normal picture: the system scales, but not perfectly — some efficiency is lost due to synchronous dependencies, network latency, or database constraints.
📦 Volume Test — Impact of Data Growth
A volume test examines how the system behaves as the amount of data increases. It’s essentially a test of architectural maturity: if the database grows several times over and performance drops only slightly, the system is well-designed and capable of scaling with data growth.
This test helps determine how resilient the architecture is to data accumulation without code changes. In the real world, a database that’s 100 GB today might reach a terabyte within a year and it’s crucial to know in advance how that will affect response time and storage load.
A volume test answers the question: “Does performance degrade gradually, or does it collapse sharply once a certain data volume is reached?”
💾 When it’s especially useful:
- during migrations and data replication;
- when switching to a new database or changing storage schema;
- when assessing the performance of large-scale read/write operations.
It shows how quickly and accurately the system processes large datasets and helps forecast potential issues before they appear.
💡 A volume test reveals how your system ages with its data and when it’s time to revisit queries, indexes, or storage architecture.
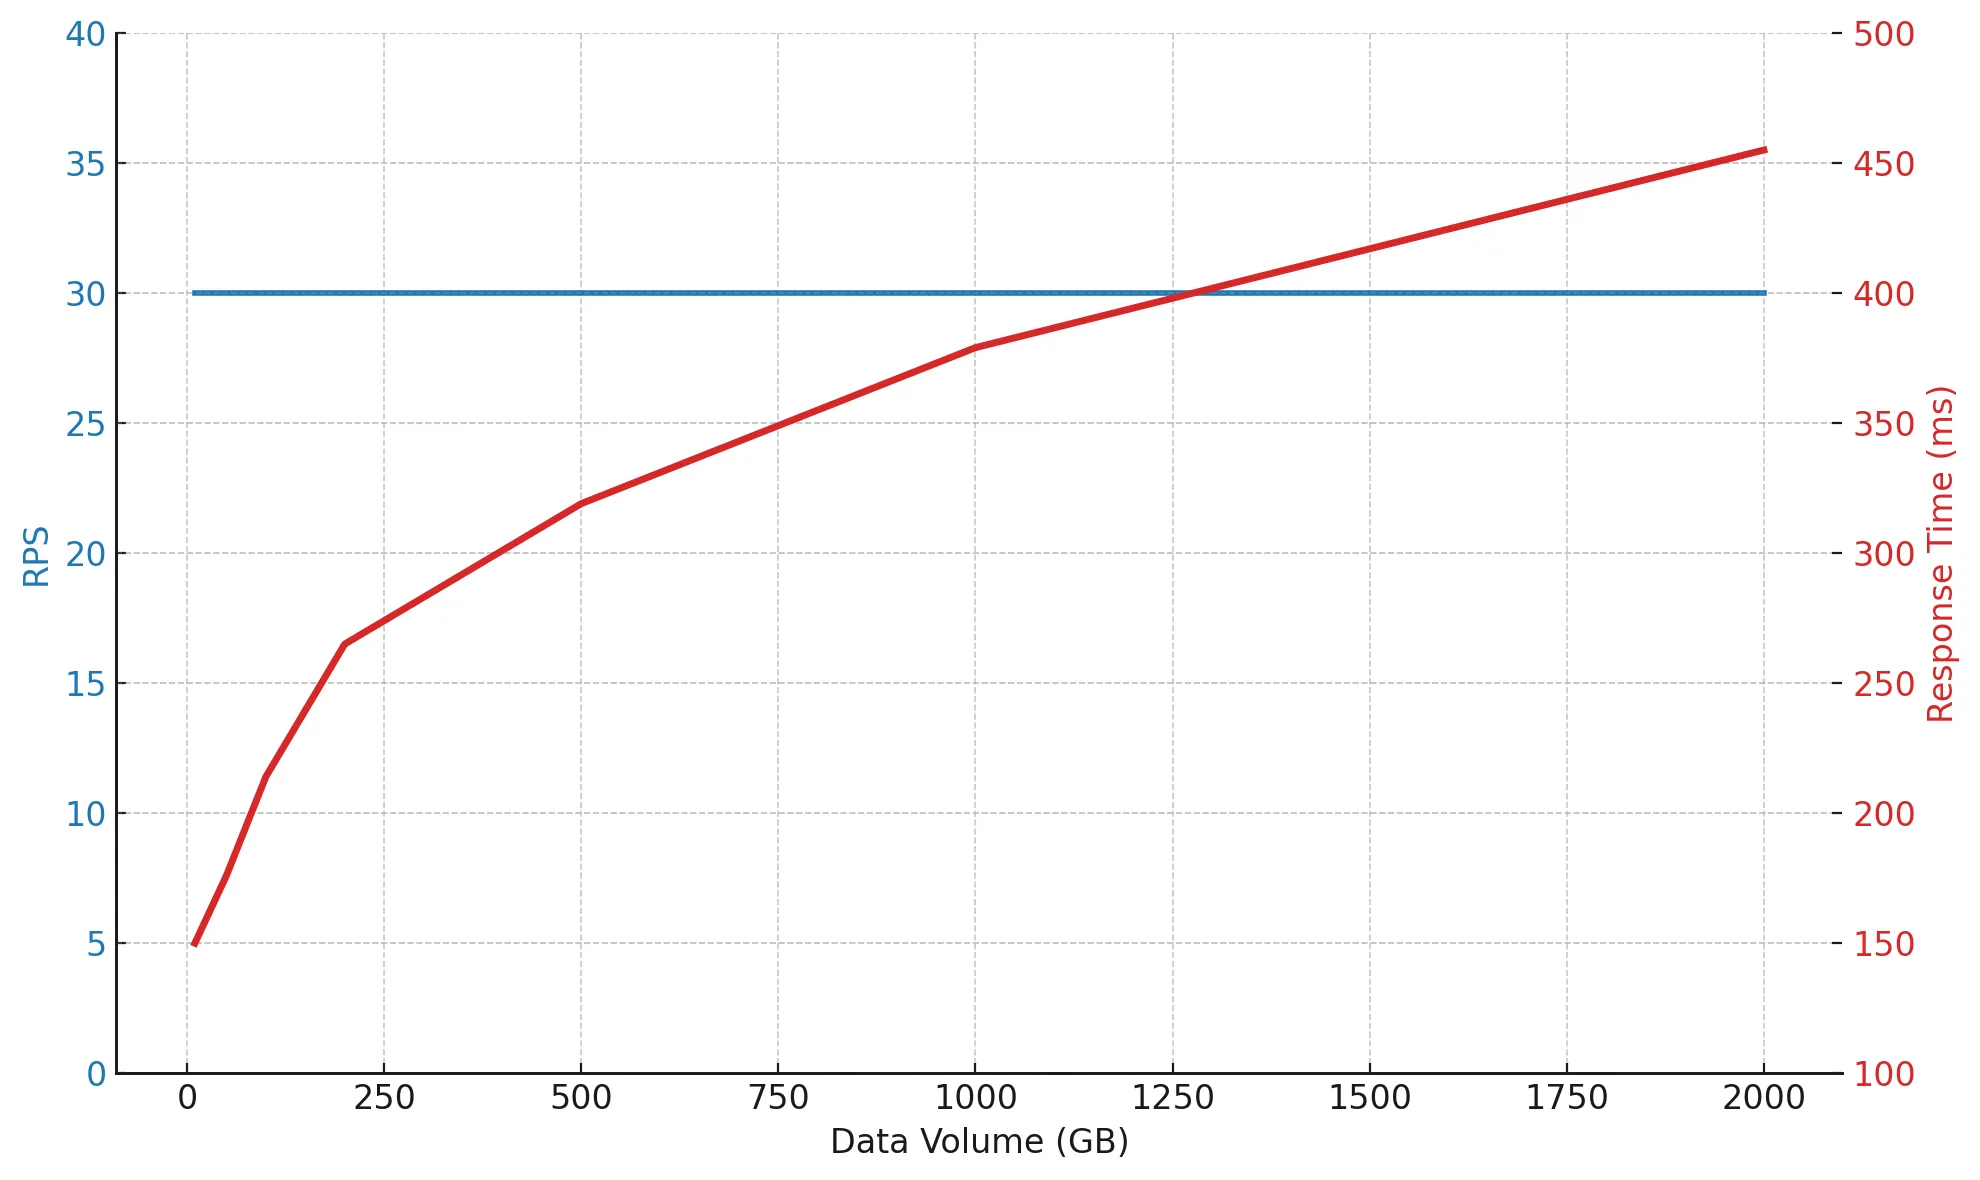
As the data volume grows from 10 to 2000 GB, the load remains the same — 30 RPS, but response time gradually increases from 150 to 433 ms. That’s expected: the more data there is, the longer searches, filtering, and indexing take.
💻 Client-Side — Don’t Forget the Frontend
When we talk about performance testing, most people immediately think of the backend — APIs, databases, microservices. But there’s another side to the story — the frontend, the part users actually see and experience.
Client-side tests measure how fast and smooth the interface feels: does the page load quickly, do buttons respond instantly, does the layout stay stable during rendering?
It’s not about servers. It’s about the perception of speed.
Even if the backend performs flawlessly, slow JavaScript, heavy images, or inefficient rendering can make the UI feel sluggish. That’s why client-side testing should run in parallel with backend testing, to get the full picture — from API responses to visual responsiveness. Sometimes the server returns a response in 200 ms, yet the user still feels lag because of extra logic on the frontend.
🎯 What client-side tests measure:
- LCP (Largest Contentful Paint) — how fast the main content appears;
- INP (Interaction to Next Paint) — how responsive the interface feels;
- CLS (Cumulative Layout Shift) — how stable the layout remains while rendering;
- overall loading and rendering metrics.
💡 Performance isn’t just about RPS and latency. It’s also about how fast everything looks and feels to the user. If the interface lags, users simply leave.
I’ll cover this topic in detail in a separate article — with real metric examples, tools like Lighthouse, Playwright, and DevTools, and practical approaches to testing UI performance under load.
🌀 Testing Cycle — What Comes When
This cycle isn’t a strict template. It’s a flexible strategy you can adapt to your system’s context. For web applications, the priority might be user journey speed, while for integration platforms, it’s often message stability and resilience to failures.
The key is not just to run every test, but to understand why you’re running each one and what question you want it to answer.
🔁 Example of a Basic Sequence
- 🔥 Smoke — verify that the environment is ready and everything runs correctly.
- 🚀 Capacity — find the limit where the system stops scaling.
- 📊 Baseline / Load — establish a baseline and check stability under realistic load.
- 🕒 Soak — observe how the system behaves over time and whether it degrades.
- 💥 Stress / ⚡ Spike — test how the system reacts to extreme and peak conditions.
- 📈 Scalability / 📦 Volume — assess whether performance grows with resources and data size.
- 💻 Client-Side — ensure the frontend stays smooth even when everything else is under load.
This sequence provides a complete picture of system behavior — from the first requests to crisis scenarios. It’s not just a checklist of tests but a continuous process that helps you understand how the system lives, breathes, and reacts to change.
🧩 Tests for Understanding, Not Formality
When tests are run just for the report, the process quickly turns into bureaucracy. On one project, engineers ran every scenario by the book — the graphs were smooth, metrics green, everything looked perfect. A month after release, the system crashed under real load because nobody noticed a bottleneck in the database.
On another project, the team took a thoughtful approach. A stress test revealed misconfigured timeouts just two days before release effectively saving it. This contrast perfectly illustrates the point: testing for the sake of a checkbox is pointless.
🎯 A Test Is a Tool, Not a Goal
The type of test should never be an end in itself. The goal isn’t just to run the scenario. It’s to understand how the system behaves,
where its weak points are, and what risks could explode in production.
Before running any test, ask yourself:
What do I want to learn from this test?
Sometimes a short Load test is enough to confirm stability. Other times, skipping Stress or Soak testing before a release can be dangerous.
What matters is that every test has a clear purpose and brings real value, both technical and business.
⚖️ Rationality Over Quantity
The most important skill in performance testing is rational thinking. It’s not about the number of reports or fancy graphs. It’s about choosing the smallest set of tests that gives the maximum insight.
Sometimes, it’s more important to stop at the right time and interpret results correctly than to run one more test just to be sure.
🤝 Building a Culture of Transparency and Trust
Good testing builds a culture of transparency. Everyone on the team understands the real limits of the system instead of relying on assumptions. That strengthens trust between engineers, DevOps, and business stakeholders leading to more informed decisions and fewer unpleasant surprises in production.
🩺 Diagnostics, Not Bureaucracy
Performance testing is like medical diagnostics: the goal isn’t just to take measurements, but to understand why they changed and what to do about it.
Tests are our lab results. They reflect the system’s health. Interpreted correctly, they can prevent a production heart attack and extend the product’s life.
A performance engineer isn’t just someone who runs tests.
They’re a specialist who helps teams and businesses make data-driven decisions, predict system behavior, and design more resilient architectures.