Java Thread Leak: Finding the Root Cause and Fixing It
A story about how a single unclosed ExecutorService in Java caused native memory leaks and JVM crashes. And how it was fixed.
🧵
Introduction
The project was a large e-commerce and healthcare client from the US (sorry, NDA — won’t share the name).
The stability of this module was crucial for key business processes, so the goal of the test was simple: make sure the system can handle long and heavy load without degradation.
In practice, things turned out to be a bit more interesting. During a performance run one of the services in Kubernetes started crashing from time to time with a
fatal Java Runtime Environment error
Kubernetes kept restarting it, but after a while, the crash happened again.
At first, it looked like a classic memory leak, but the heap was clean. The real problem hid deeper — in native memory and threads.
Contents
Test Context
| Parameter | Value |
|---|---|
| Platform: | Kubernetes |
| Language: | Java 17 |
| Service: | pricing component (🔒 name hidden) |
| Test type: | Capacity |
| Goal: | gradually increase the load to find the capacity point — the moment when the system reaches its performance peak before degrading |
First Analysis and Hypotheses
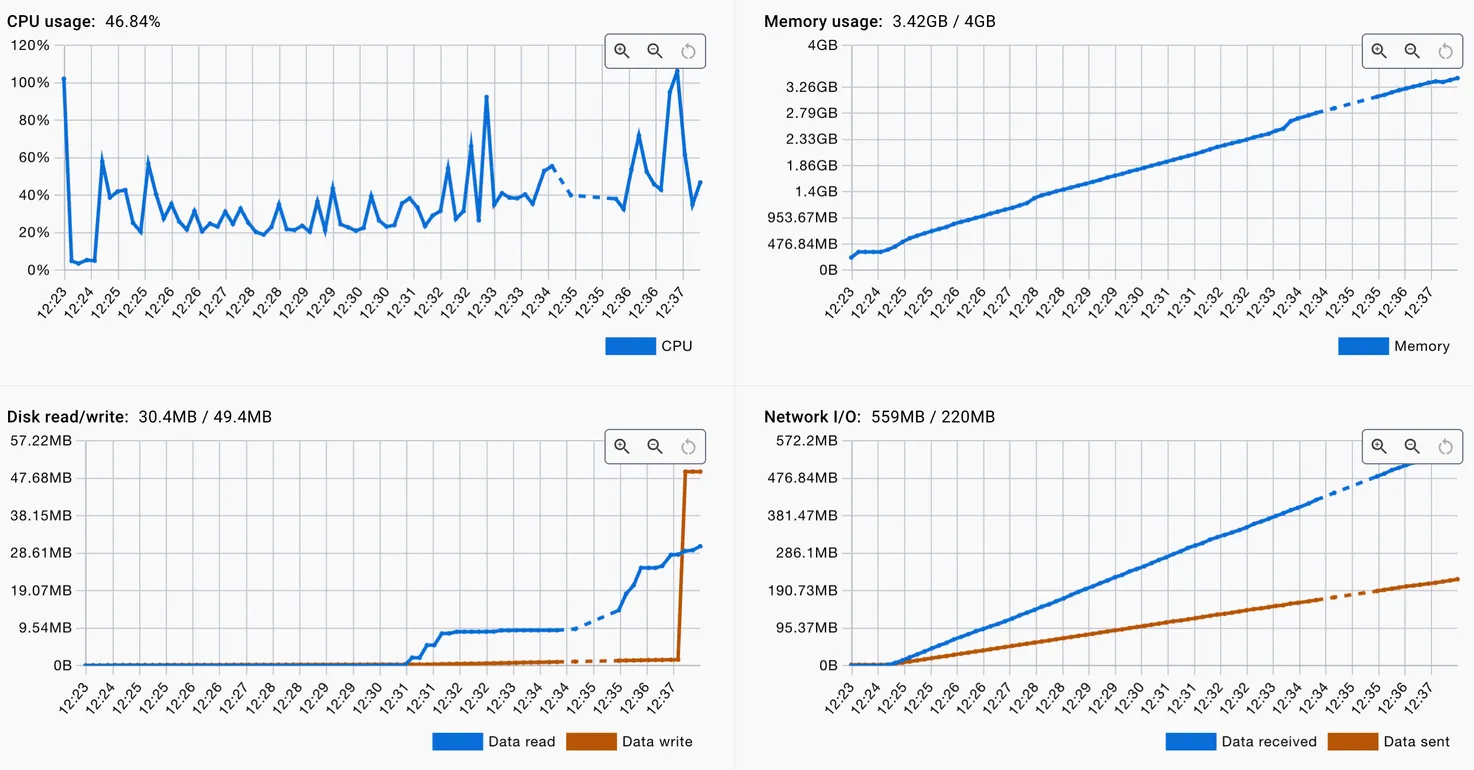
CPU usage grew slowly and linearly, but memory kept growing until it hit the limit every time.
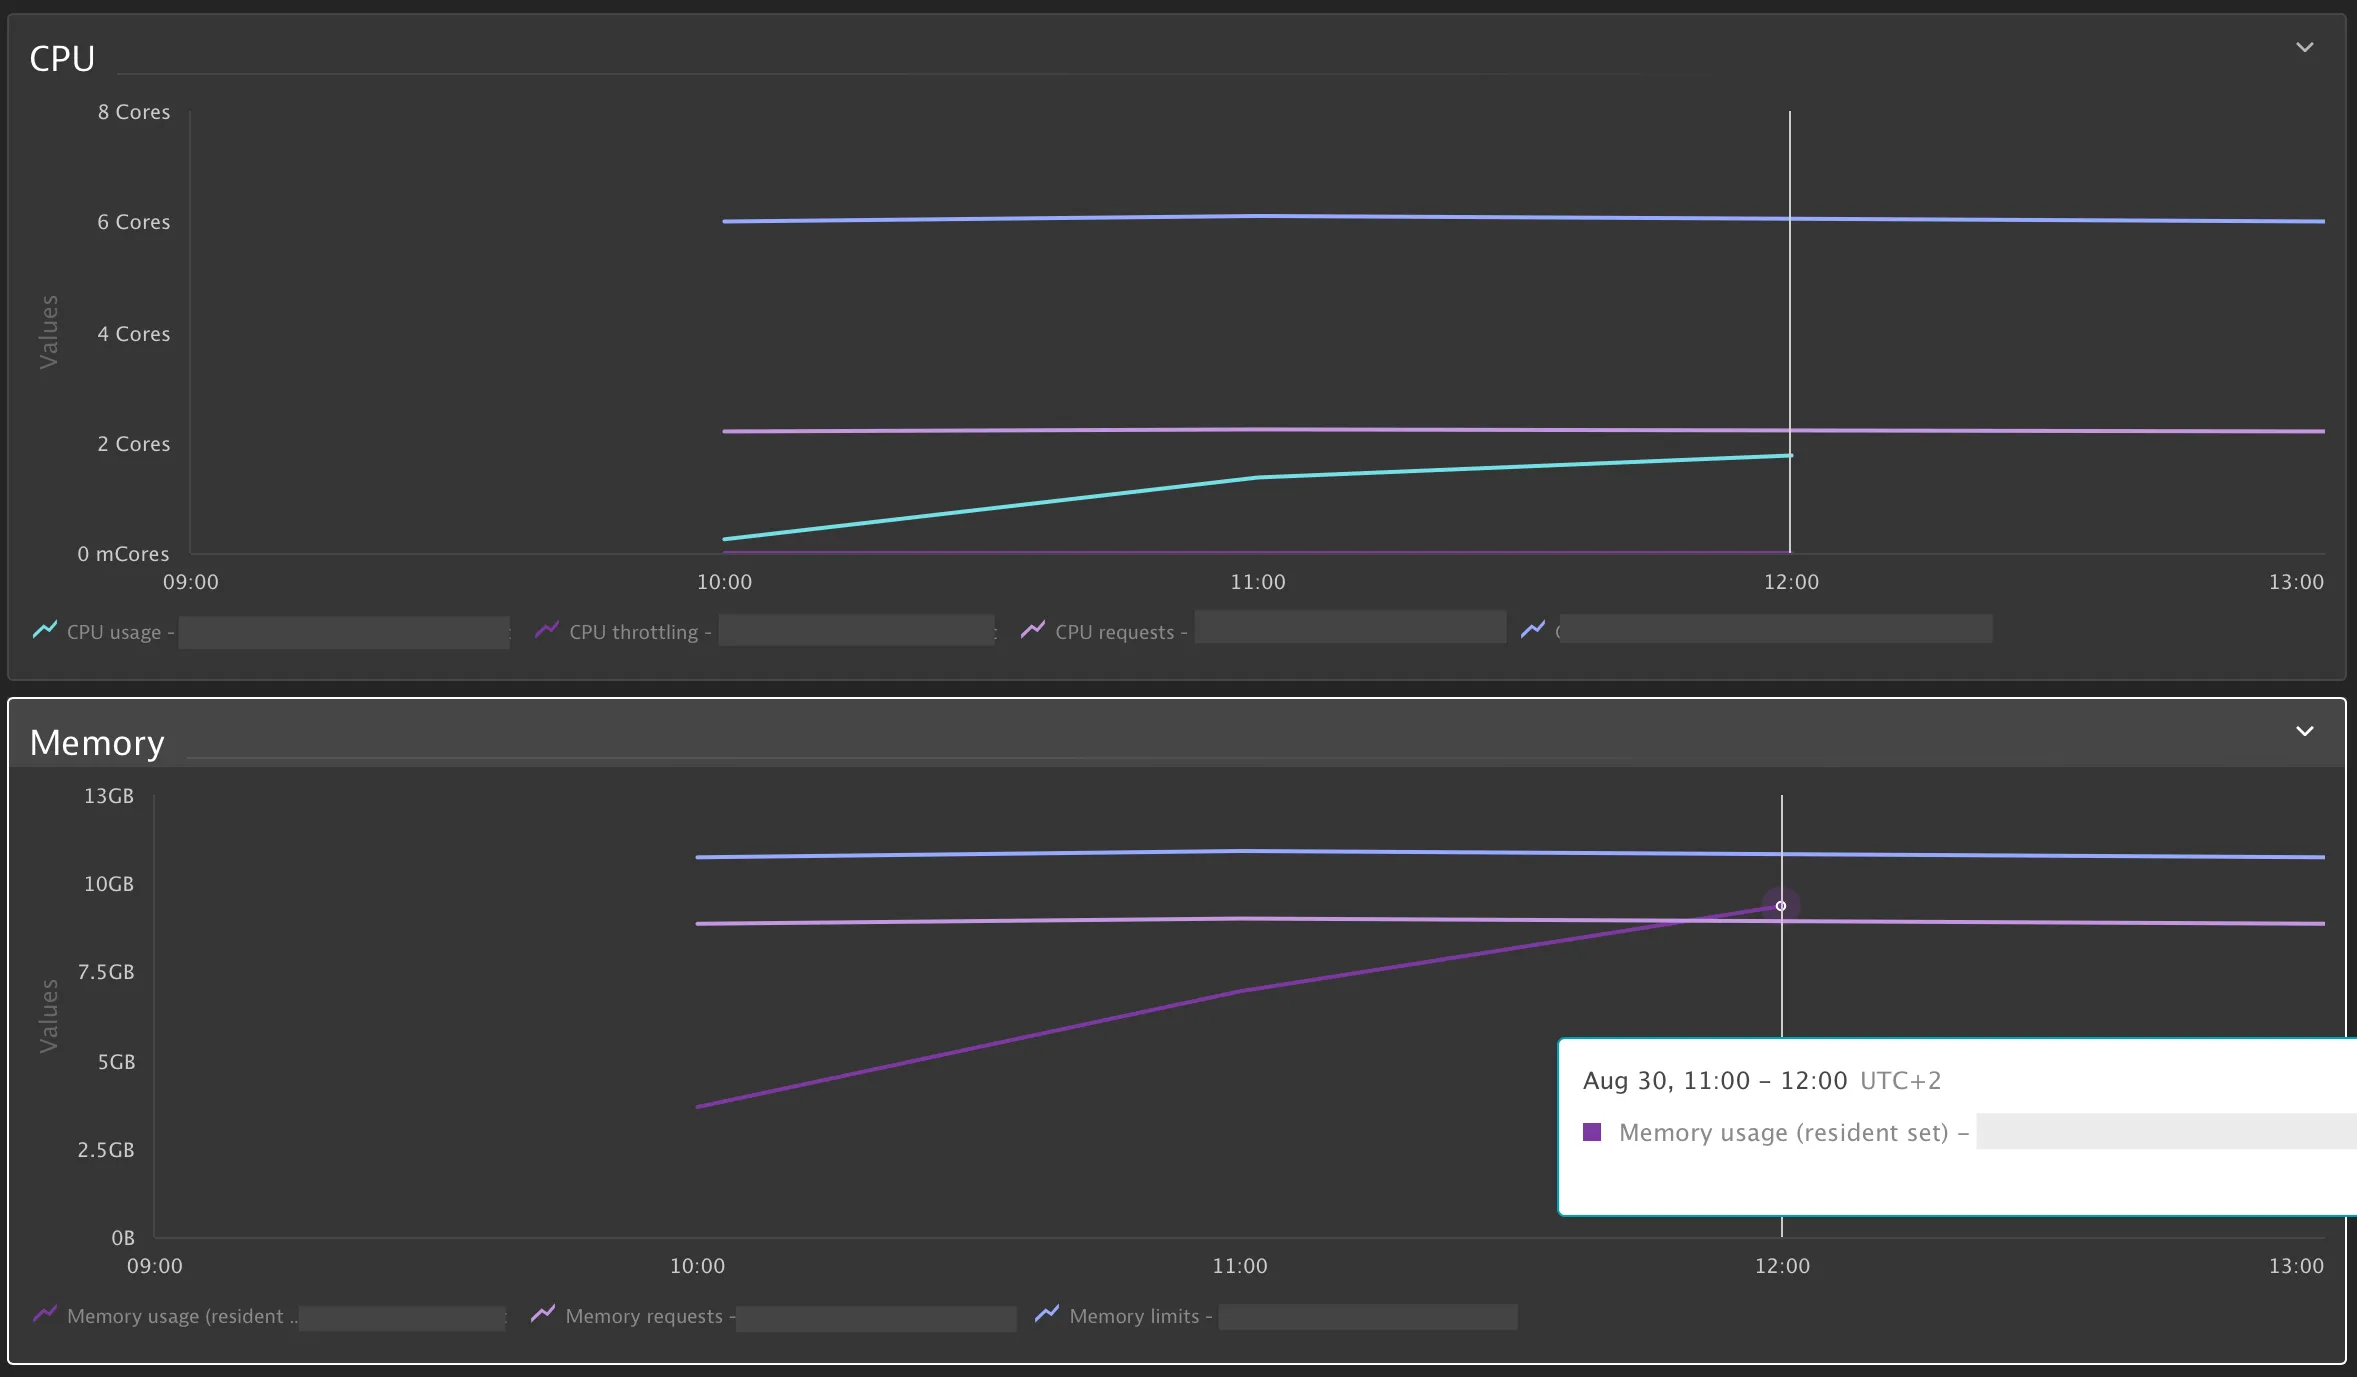
To rule out external factors, I ran the same service locally in Docker Desktop and launched the same test again.
The result was identical: memory grew steadily, CPU remained stable. So the service wasn’t overloaded with computations — memory was leaking.
Alright, so it wasn’t the infrastructure — it was native memory. And the JVM logs confirmed that:
A fatal error has been detected by the Java Runtime Environment:
Native memory allocation (mprotect) failed to map memory for guard stack pages
Attempt to protect stack guard pages failed
os::commit_memory(...): error='Not enough space' (errno=12)
In plain English:
There were too many threads, and the OS simply ran out of space to allocate stack memory for new ones.
Finding the Cause
Looking through the code quickly led to a suspicious part: inside the enrich() method, a new ExecutorService was created on every call.
It looked neat — CompletableFuture, async calls, familiar pattern. But the thread pool was never closed.
❌ Before Fix
ExecutorService executor = Executors.newFixedThreadPool(WORKERS);
CompletableFuture<Void> prices = CompletableFuture.runAsync(
    () -> enrichPrices(context, productIds), executor);
CompletableFuture<Void> products = CompletableFuture.runAsync(
    () -> enrichProducts(context, productIds), executor);
joinAndRethrow(prices, products);
Each request created a new thread pool. The threads stayed alive and gradually filled up the memory until the JVM hit its limit.
The Fix
❌ First Solution (wrong approach)
The initial fix seemed logical: add a try/finally block and close the pool after each use.
ExecutorService executor = Executors.newFixedThreadPool(WORKERS);
try {
    CompletableFuture<Void> prices = CompletableFuture.runAsync(
        () -> enrichPrices(context, productIds), executor);
    CompletableFuture<Void> products = CompletableFuture.runAsync(
        () -> enrichProducts(context, productIds), executor);
    joinAndRethrow(prices, products);
} finally {
    executor.shutdown();
}
The problem: While this stopped the memory leak, the approach was fundamentally wrong. We were creating a pool of N threads for each request and immediately destroying it. Creating and destroying threads is an expensive operation that:
- Creates unnecessary system overhead
- Reduces performance under high load
- Contradicts the very purpose of thread pools (resource reuse)
✅ Correct Solution
The right approach is to create a thread pool once at application startup and reuse it for all requests.
Pool initialization (e.g., in Spring configuration or at component startup):
@Configuration
public class ExecutorConfig {

    @Bean(destroyMethod = "shutdown")
    public ExecutorService enrichmentExecutor() {
        return Executors.newFixedThreadPool(WORKERS);
    }
}
Using it in the method:
private final ExecutorService executor; // injected via constructor

public void enrich(Context context, List<String> productIds) {
    CompletableFuture<Void> prices = CompletableFuture.runAsync(
        () -> enrichPrices(context, productIds), executor);
    CompletableFuture<Void> products = CompletableFuture.runAsync(
        () -> enrichProducts(context, productIds), executor);
    joinAndRethrow(prices, products);
}
Why this is better:
- Efficiency: threads are created once, not per request
- Performance: no overhead from thread creation/destruction
- Control: easy to manage thread count and lifecycle
- Graceful shutdown: Spring (or other container) will properly close the pool when the application stops
After refactoring, the system became not only stable, but also efficient — each request uses ready threads from the pool.
Verification
A rerun confirmed the result:
✅ memory leveled off;
✅ thread count stopped increasing;
✅ no more JVM errors.
The service became predictable and stable, even under long load.
Takeaways
This story is a great example that not every fix is the right fix. One unclosed ExecutorService created a memory leak, but the right solution wasn’t just to “fix the leak” — it was to rethink the thread management architecture.
⚠️ Important lesson:
Closing ExecutorService after each use is an anti-pattern. Thread pools exist precisely for reuse, not for single use.
💡 What to remember:
- JVM errors related to native memory often point to thread leaks, not the heap.
- Creating a thread pool per request is an architectural mistake, even if you properly close it.
- The right approach: create the pool once at application startup and reuse it throughout its lifecycle.
- Capacity and long-run tests help identify not only leaks, but fundamental architectural problems.