This parser service is part of my GetMeOne side project. It is a Java service that fetches listing data from external platforms, extracts structured fields, and sends the results further down the pipeline.
I started this investigation because the service felt expensive in a way that was hard to explain. The first profiles pointed to CPU work inside the parser. Later profiles told a different story. The interesting part was not one fix or one hot method. It was how the bottleneck kept moving every time the parser became cleaner.
First observations
The investigation started with JFR to get a broad picture. After that I used async-profiler and Pyroscope to compare hot paths between runs more easily.
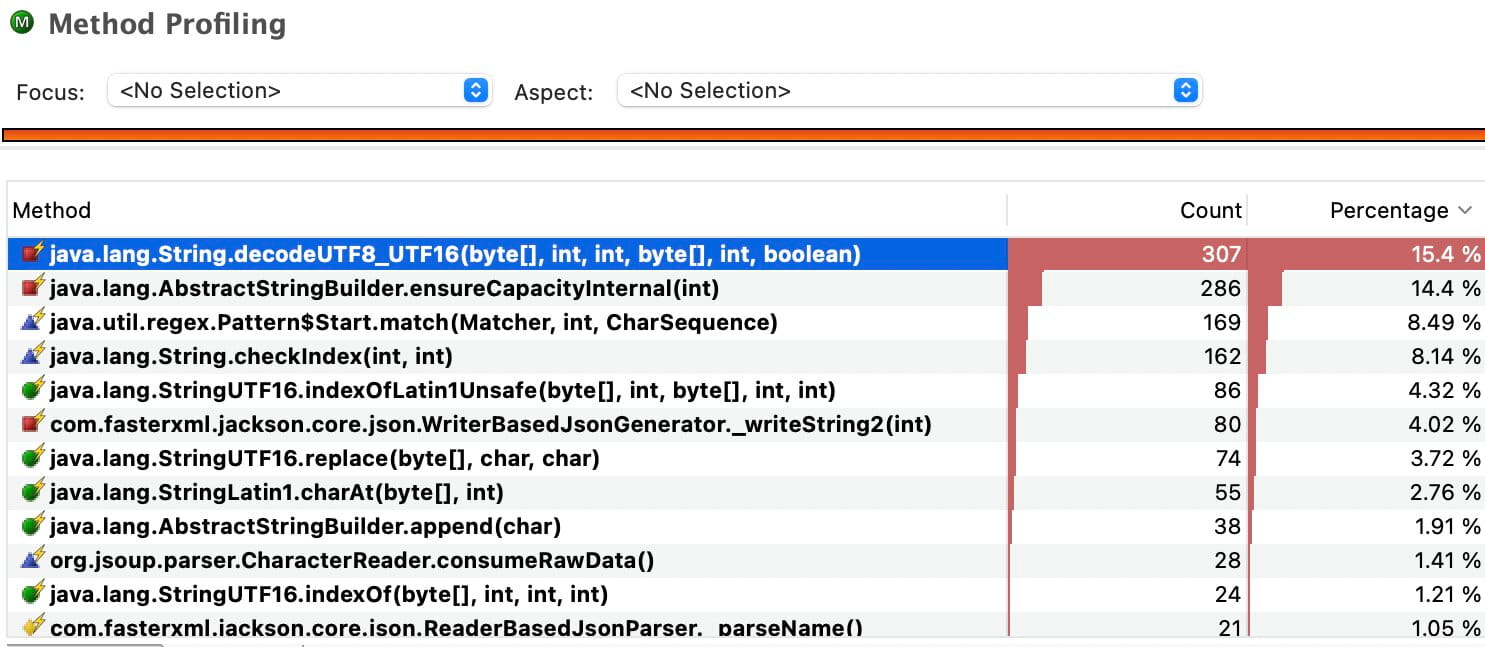
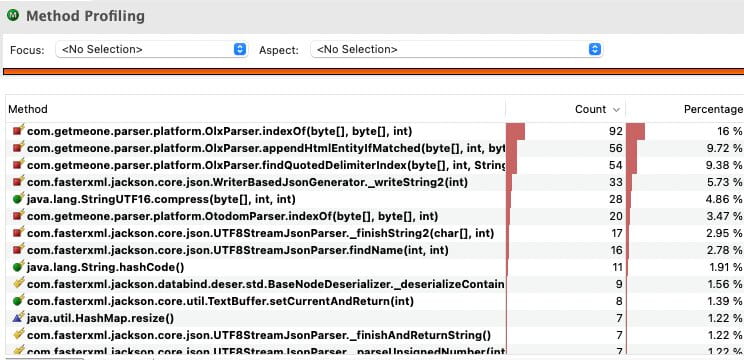
The early CPU profiles were quite clear. A large part of the work was string-heavy:
- UTF-8 decoding
StringBuildergrowth- regex matching
- substring and replace chains
- text-heavy parsing around HTML and JSON
This was visible both in the top methods and in the flame graphs. The parser was spending a lot of time in generic text handling before it even got to the part that looked like real parser logic.
There was also some noise around scheduling and profiling overhead early on. One worker often looked idle because the parser ran platforms through one scheduler cycle, and one platform could end up waiting for the other. That was worth fixing, but it was not the main story. The main story was still inside the parsing path.
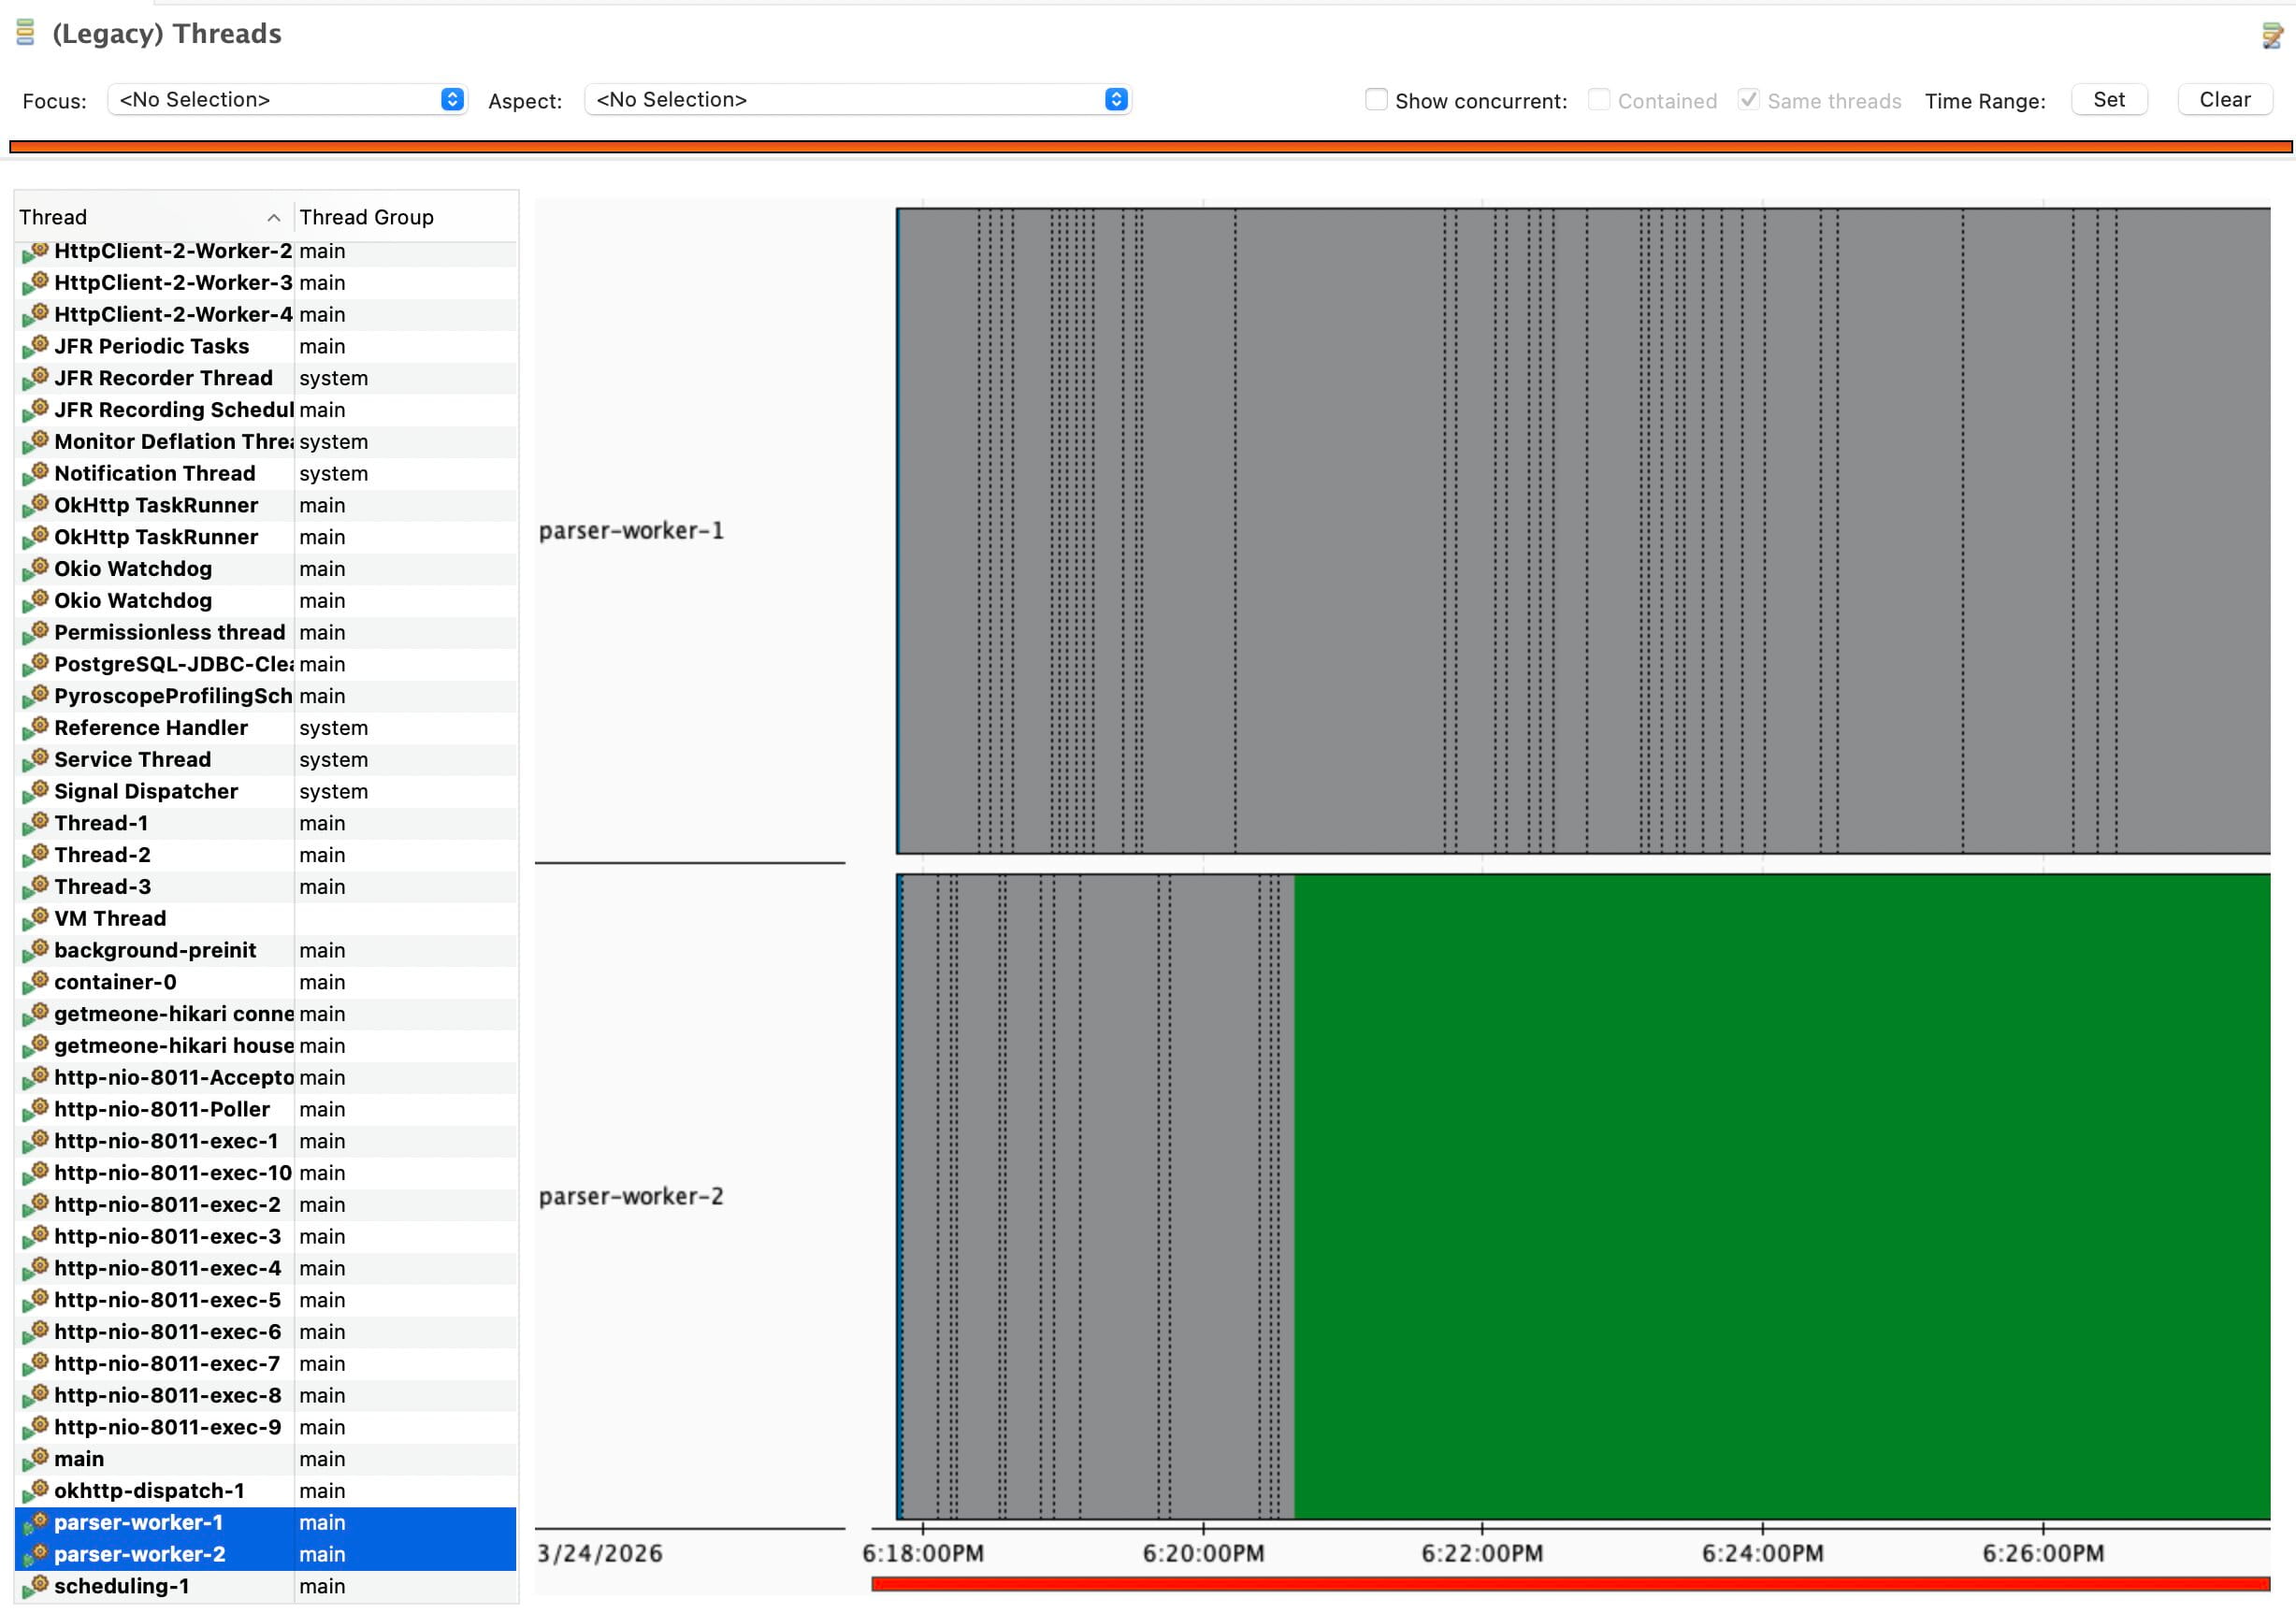
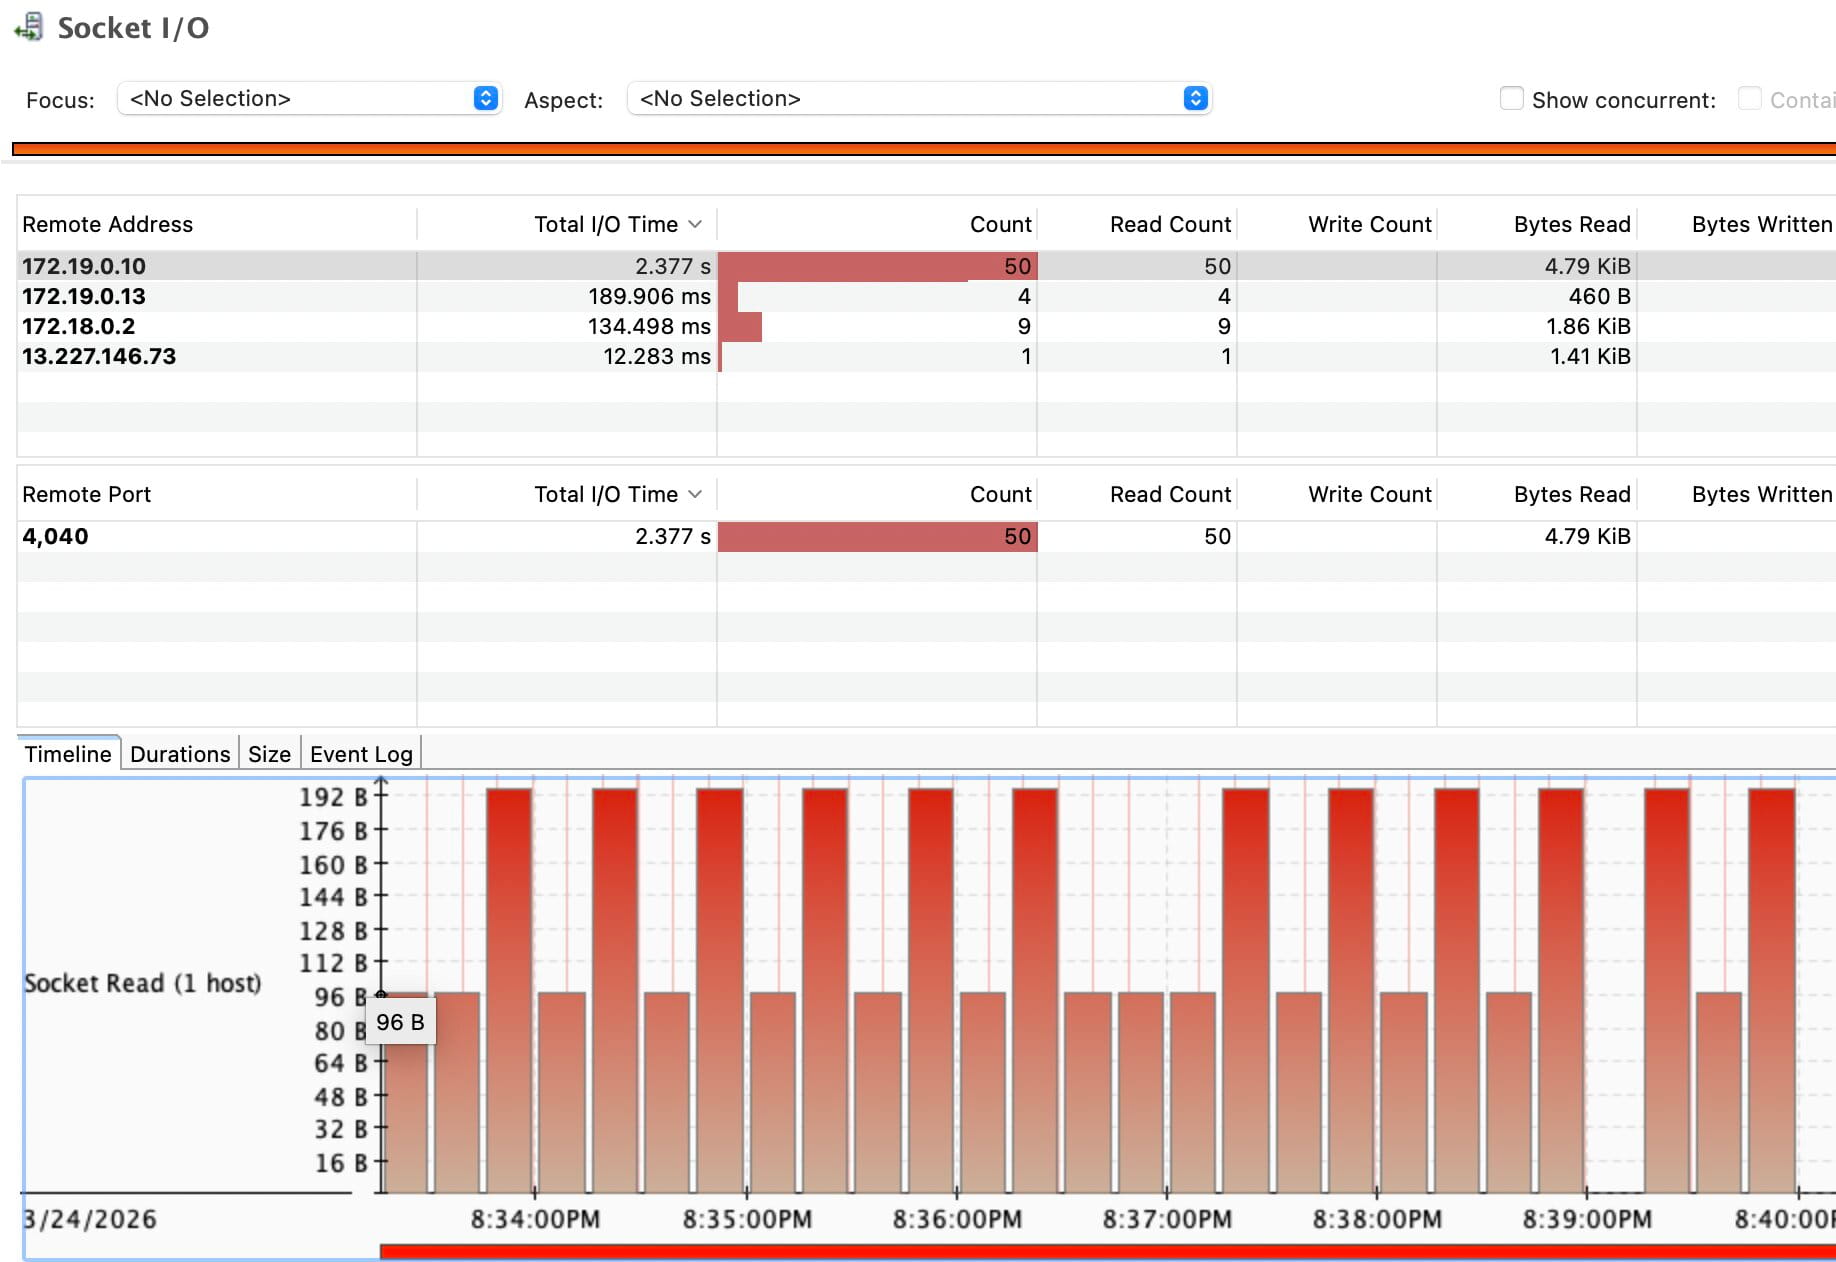
Another early signal came from JFR socket activity. Part of the runtime was already sitting in I/O-related paths, even before the parser internals were cleaned up.
First hypothesis
The first working model was simple: the service was spending too much CPU on string processing. Not because one method was broken, but because the whole parsing path moved into strings too early.
The pattern looked like this:
- fetch a response as bytes
- convert the whole payload into a
String - search and cut fragments out of it
- run more transforms on those fragments
- decode or unescape text again
- pass the result to JSON parsing
That kind of pipeline creates string churn. Large payloads are decoded early, then copied again through substring-style work, regex handling, replacements, unescaping, and buffer growth. In the profile, this showed up in methods like UTF-8 decoding and ensureCapacity. But those methods were not the cause. They were only the place where the cost became visible.
The real issue was that the parser kept rebuilding text forms of data that already existed as bytes.
First wave of changes
The first set of changes followed one idea: keep responses in bytes for longer and move the conversion boundary as late as possible.
That led to a few structural changes:
- move away from string-heavy parsing toward byte-oriented processing
- delay
byte[] -> Stringconversion - parse JSON directly from
byte[]orInputStreamwhere possible - reduce regex, substring, and replace chains
- avoid parsing full HTML when only one embedded payload is needed
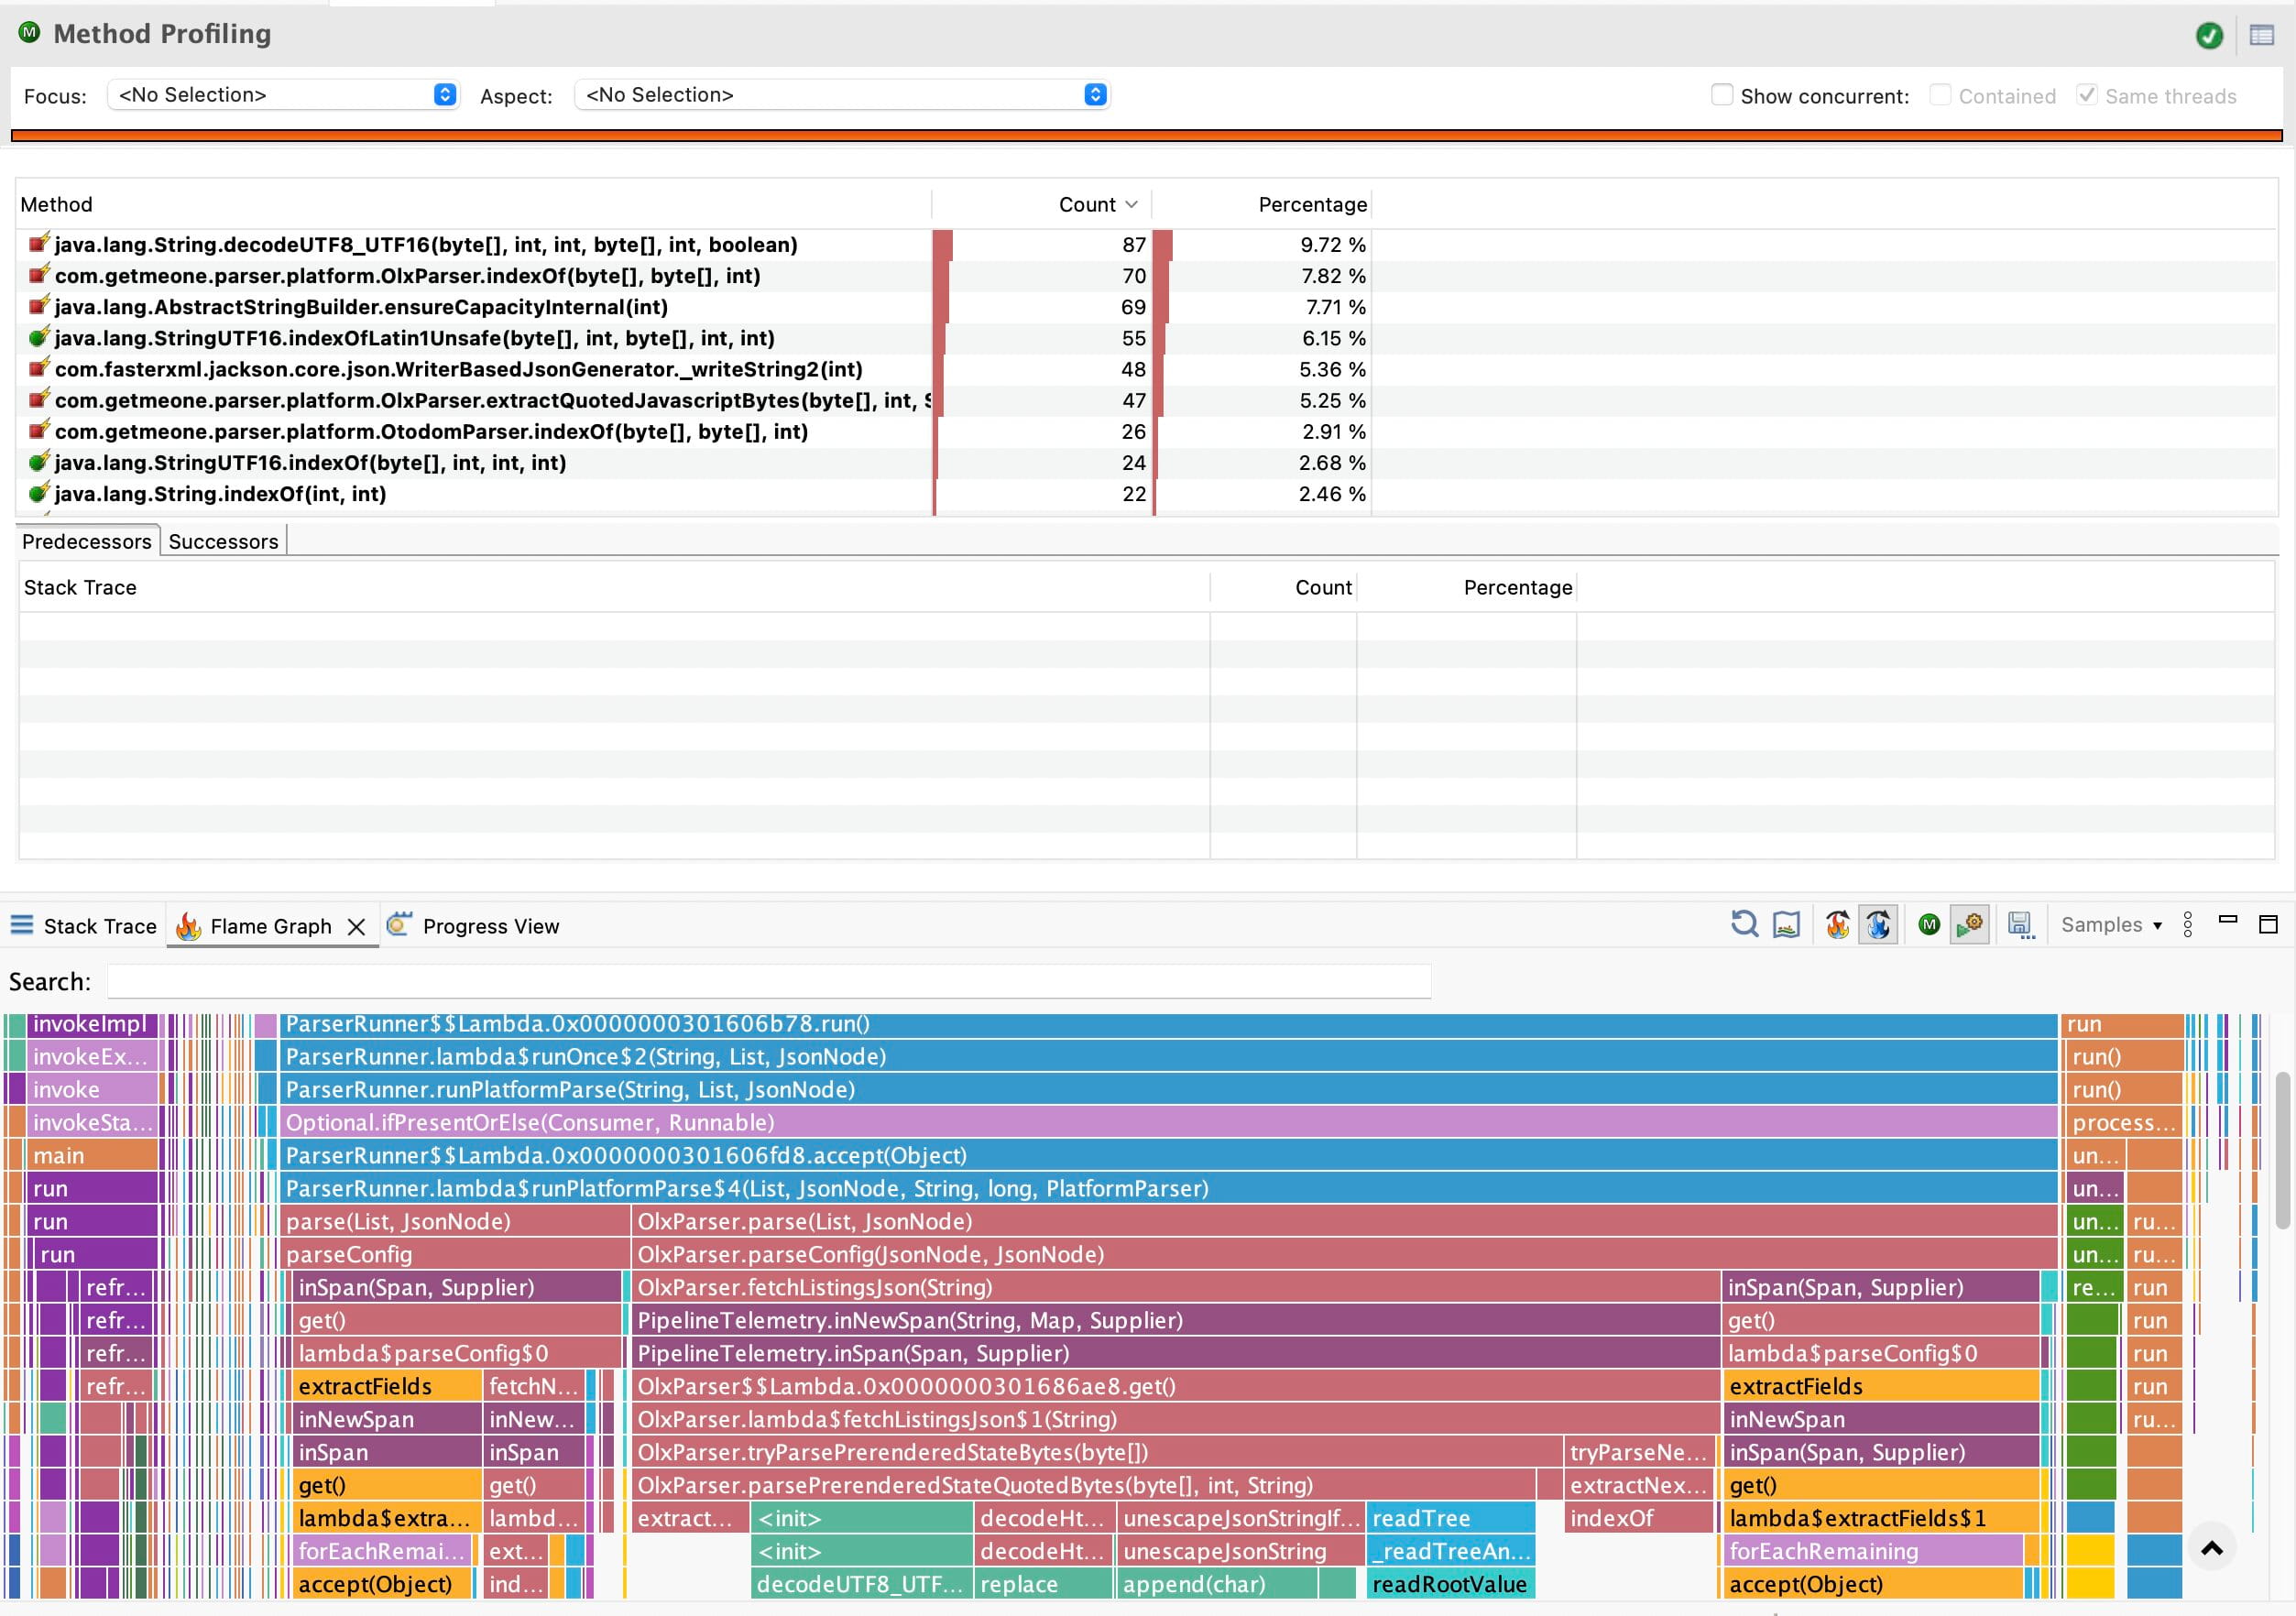
This mattered most in the OLX path. A large part of the CPU cost there came from extracting quoted JSON-like payloads out of HTML through a very string-heavy flow. Otodom had a weaker version of the same problem because it also moved to text too early.
The goal was not to remove work. The goal was to stop doing the same work through too many layers of strings and copies.
What changed after that
The first result was clear in the CPU profile.
The old hotspots became smaller:
- less time in UTF-8 decoding
- less time in
StringBuildergrowth - less weight in the string-heavy subtree overall
At the same time, a new hotspot appeared. The cost moved into ByteArrayOutputStream.ensureCapacity(...) and related buffer growth paths.
That was not a failure. It was the next layer of the same cost becoming visible.
Earlier, the parser was paying for text churn in a broad and messy way. After the first changes, the profile became narrower. The parser still had to decode and assemble a payload, but now that work happened in a more explicit byte-oriented path. The overhead had not vanished. It had become easier to see and reason about.
This was an important transition point. The flame graph stopped looking like generic string machinery and started looking more like parser internals.
Second wave of changes
The next obvious target was the growable output buffer.
Once the hot path had moved into byte-oriented decoding, repeated buffer growth became expensive enough to show up clearly. The parser was no longer dominated by string churn, but it was still paying for reallocations and copies while building decoded output.
The second wave of changes replaced growable buffer logic with a more fixed or pre-sized byte[] approach. The intent was narrow:
- reduce reallocations
- reduce repeated copy-on-growth behavior
- keep the decode path linear and predictable
Before that rewrite fully settled, the profile made the new cost very clear. The main hotspot was no longer generic string churn but ByteArrayOutputStream.ensureCapacity(...).
After that rewrite, the profile changed again.
ByteArrayOutputStream.ensureCapacity(...) disappeared from the top. The main hotspots became byte scanning methods, delimiter search, and a smaller amount of JSON parsing work. That was a much cleaner profile. The parser was now spending CPU on operations that matched its real job.
At that point the bottleneck progression already had a clear shape:
- string churn
- buffer growth
- byte processing
That progression mattered more than any single screenshot. It showed that waste was being removed layer by layer.
Turning point
By this point the CPU profile looked much better.
The parser internals were easier to read in the flame graph. The string-heavy fallback path no longer dominated. Buffer growth was no longer sitting at the top. The hot path had become shorter and more direct.
But one question remained awkward: how much did this actually change the runtime of the service as a whole?
The answer was not obvious from CPU profiling alone.
This is where the investigation changed character. CPU profiling was useful because it explained where CPU time went. But it could not fully explain why the service still felt limited. A parser can have a better CPU profile and still spend most of its lifetime waiting.
That difference turned out to matter more than the parser micro-optimizations themselves.
The before and after flame graphs made that local improvement visible. The old string-heavy subtree became much smaller, and the hot path became shorter and more direct.
Wall profiling
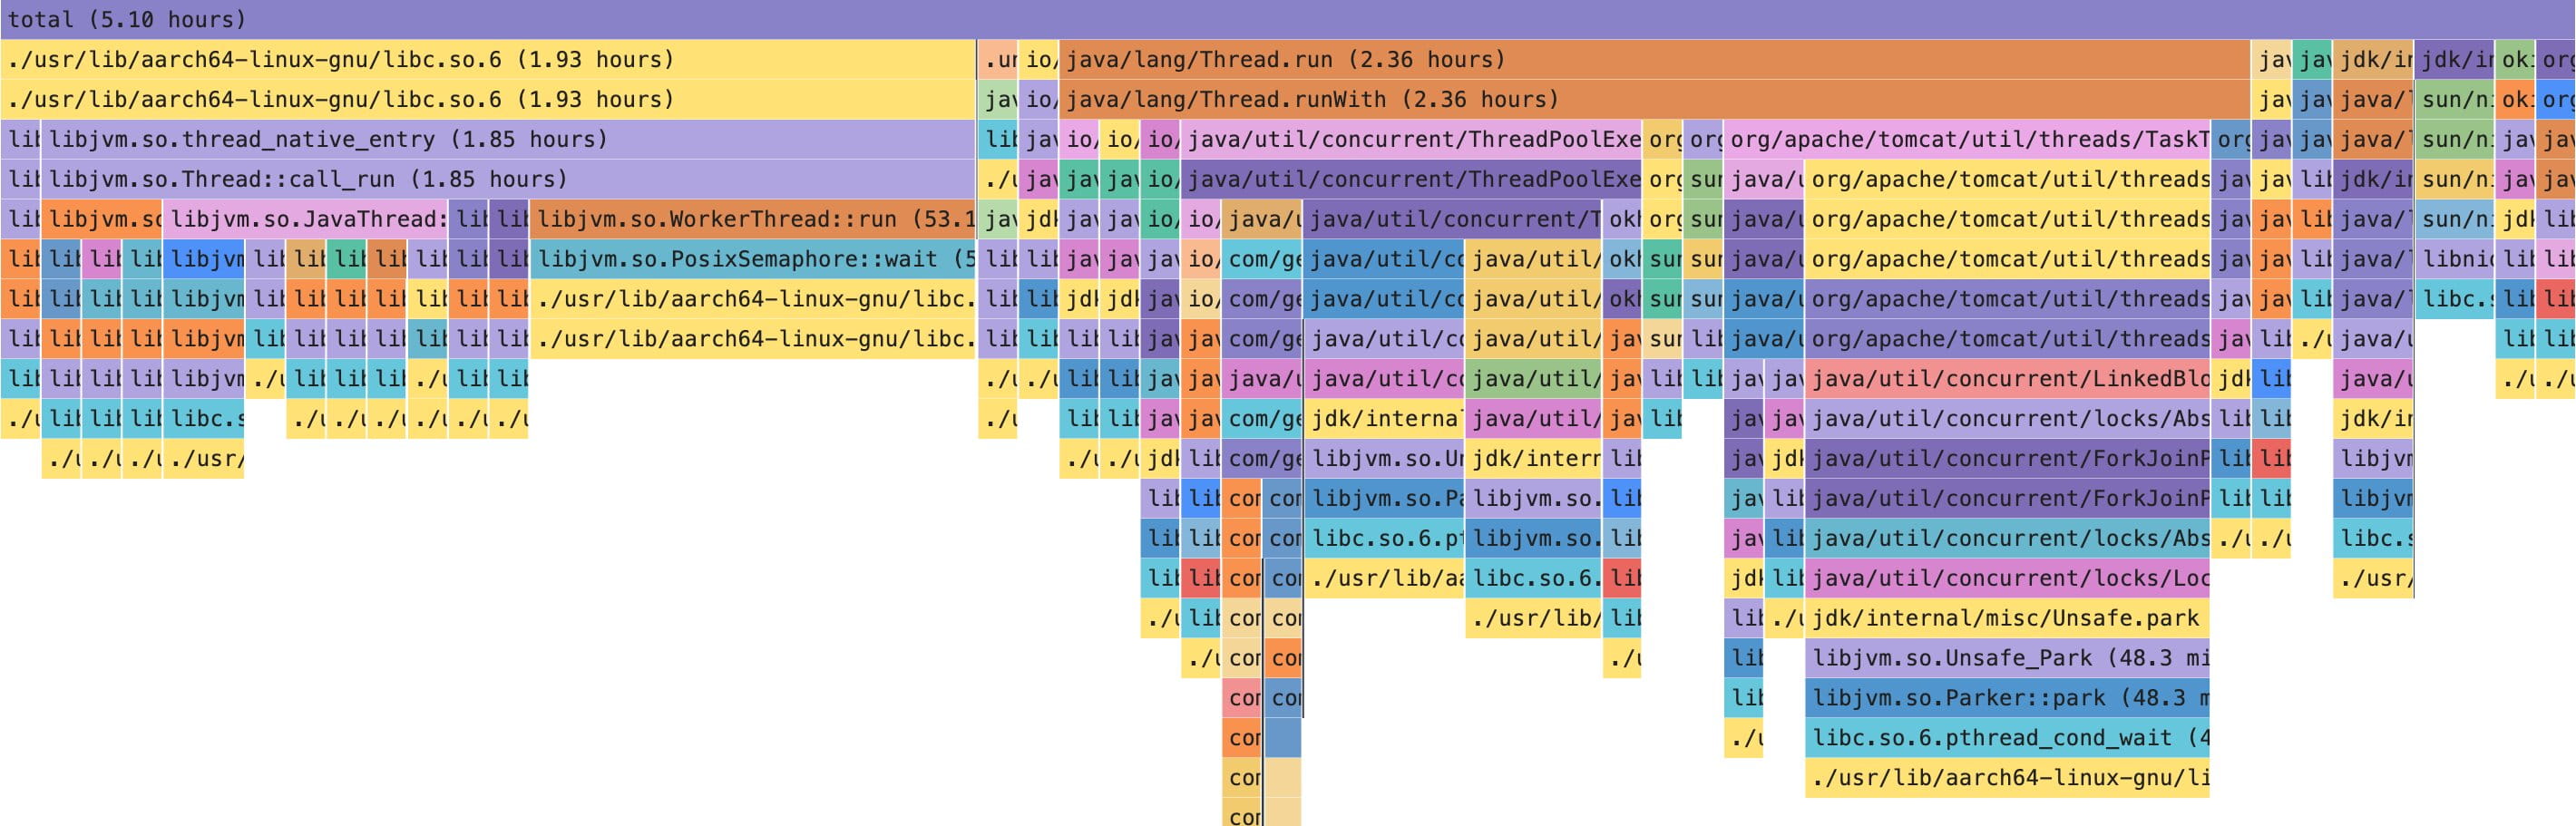
Wall profiling made the missing piece visible.
Once the service was observed from a wall-time perspective, most of the time was not in parsing code at all. It was in waiting:
- HTTP fetches
- socket reads
- JDK HTTP client paths
- parked threads
epolland poll-style waits- lower-level libc frames associated with blocking I/O
The busiest part of the real timeline was not the parser transforming bytes. It was the service waiting for something outside the process to respond.
This also helped interpret the CPU profiles more carefully. CPU hotspots had been real. The parser did spend unnecessary CPU on string-heavy work, and cleaning that up was valid. But once that local waste was reduced, the larger constraint became easier to see: end-to-end runtime was mostly shaped by external I/O, not by Java compute.
That is the point where the system stopped looking CPU-bound and started looking I/O-bound.
Rethinking the system
Once the wall profile was in place, the center of gravity moved outside the JVM.
The main bottleneck was no longer the parser code in isolation. It was the cost of talking to external dependencies:
- how many external calls had to be made
- how expensive each call was
- how much waiting came from external response time
- how retries, warmups, and pauses changed wall time
This did not make the CPU work irrelevant. It changed its place in the hierarchy.
CPU cleanup improved the parser internals. It reduced avoidable allocation pressure. It made the hot path easier to reason about. But it did not become the main control over service performance. The main control was higher up, in how the service interacted with external systems.
In this case the external dependency was a website. But the pattern is broader than that. The same shape appears in any service that spends a lot of time waiting on something outside its own process: a database, a third-party API, a queue, a search engine, or another internal service. Once that happens, local CPU cleanup still matters, but it stops being the main lever.
That shifted the analysis from code-level thinking to system-level thinking. The useful question was no longer “how do I make this method cheaper” but “what part of the runtime is actually under local control.”
Concurrency discussion
Once the system looked I/O-bound, concurrency became the next obvious lever.
On paper, it looked reasonable. If workers spend a lot of time waiting for external responses, more parallelism could hide some of that wait and improve throughput. That was explored, especially around per-platform processing and detail-fetch concurrency.
The result was not strong enough to keep.
The gains were limited, while the side effects were more serious:
- higher risk of anti-bot limits
- more empty responses
- more timeouts
- worse stability in long runs
- more operational uncertainty
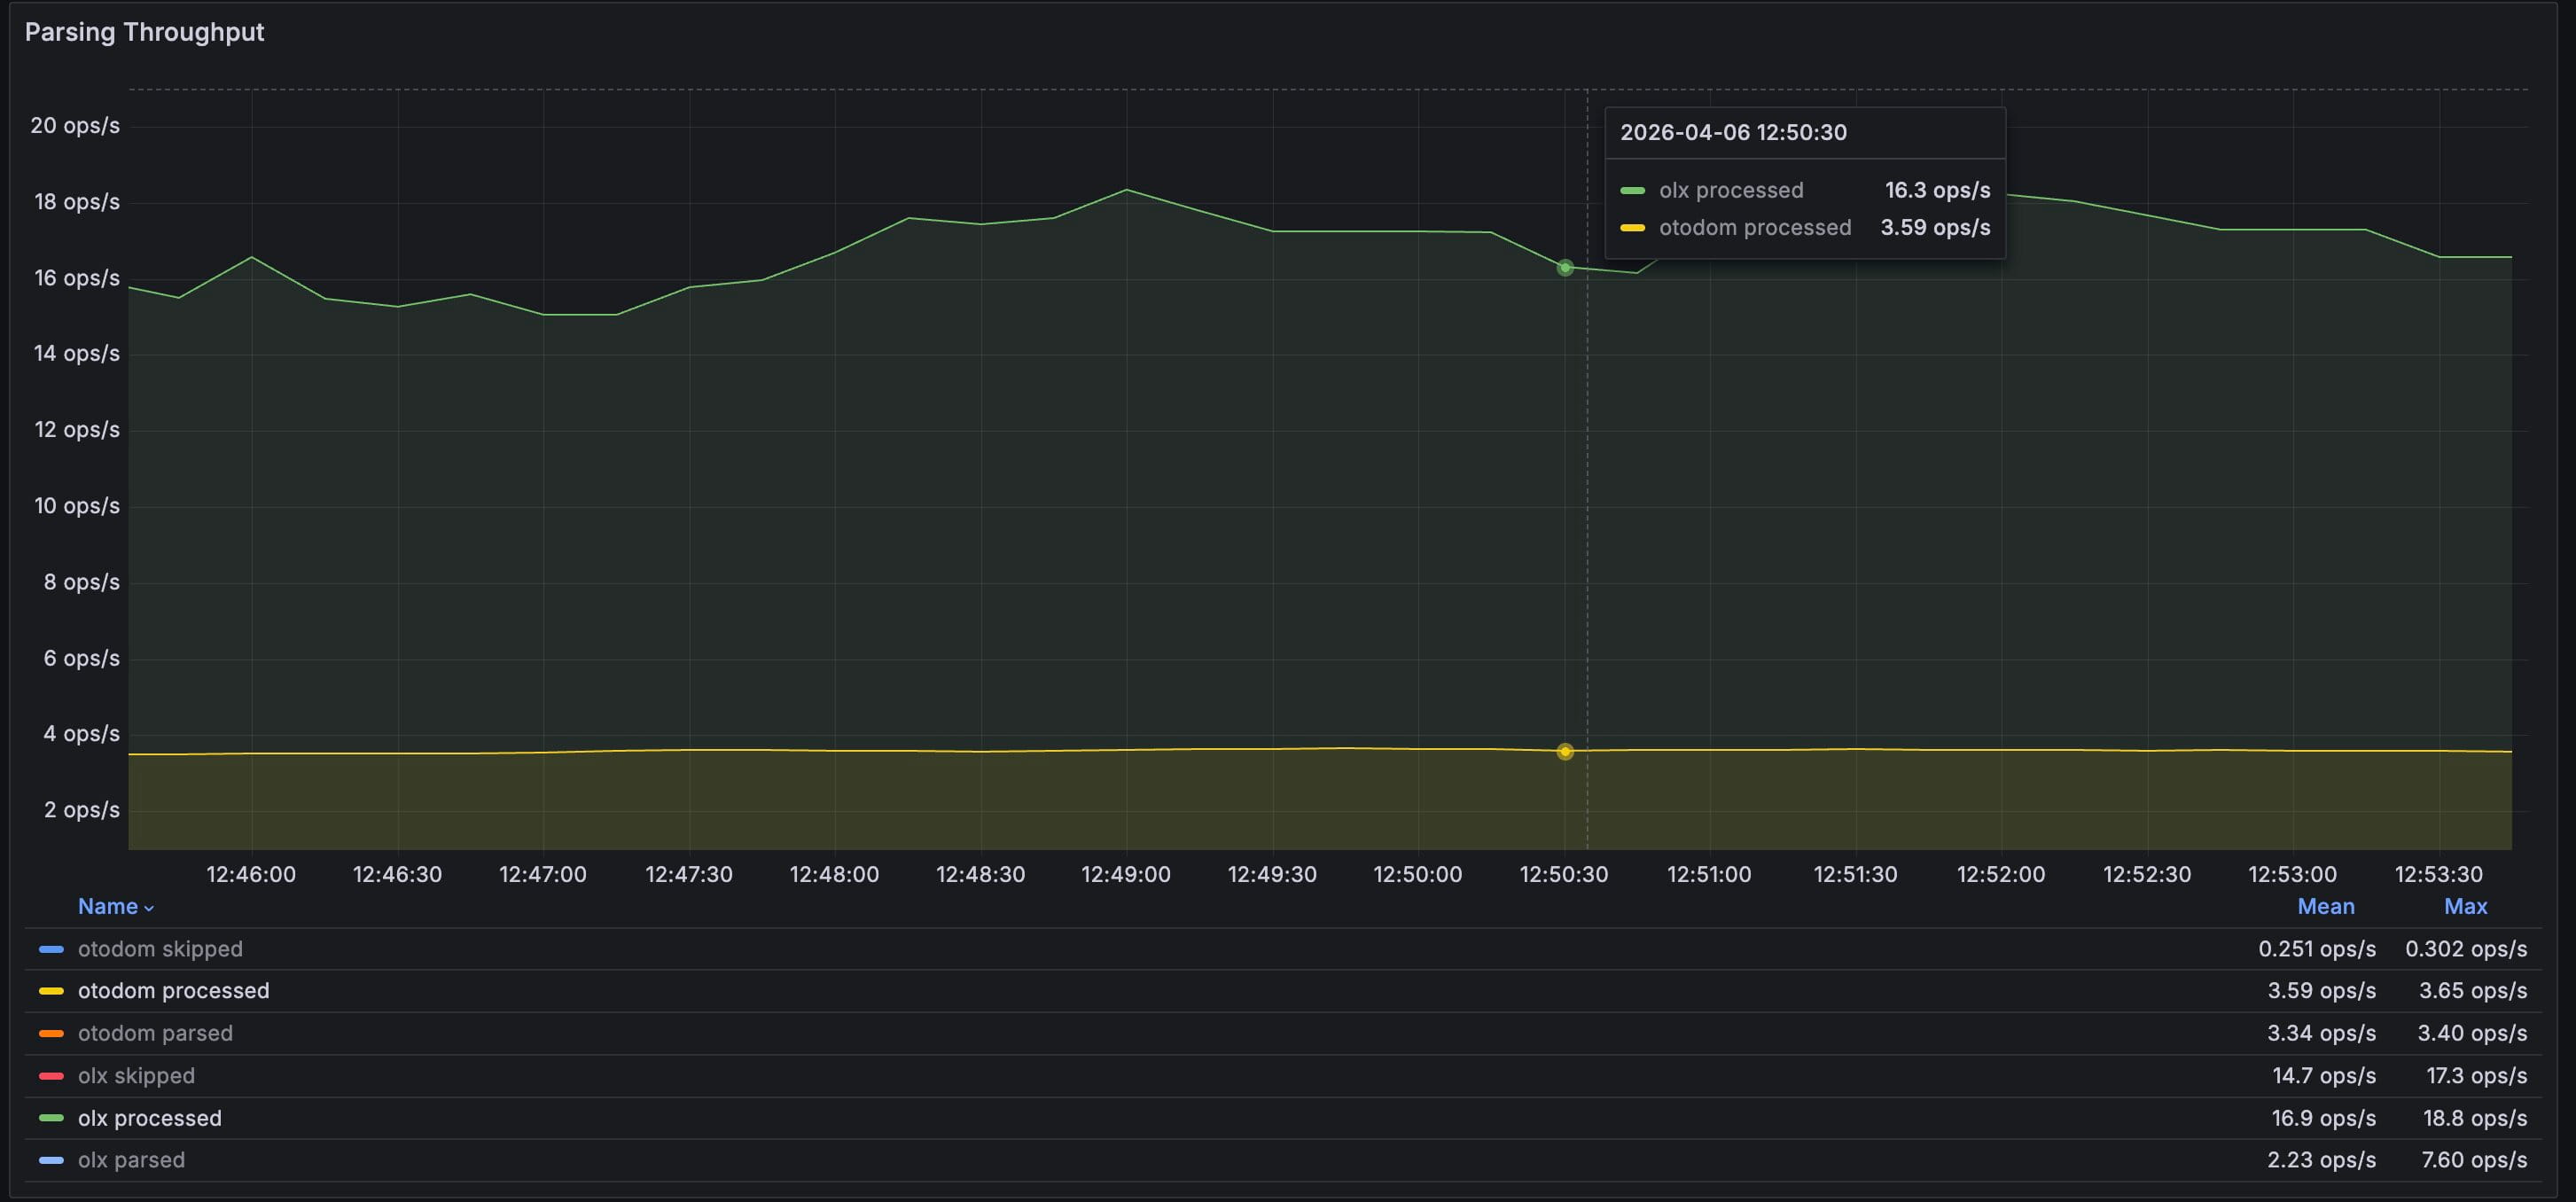
On Otodom the throughput gain was constrained. On OLX the extra parallel pressure did not produce a clear qualitative win and came with timeout risk. In that context, single-thread-per-platform stopped looking like a missed optimization and started looking like a rational trade-off.
For this service, predictability matters more than local concurrency wins within a narrow throughput range. A stable long-running parser is more valuable than a slightly faster one that becomes harder to trust.
The throughput view did show useful work being processed, but the gains from extra concurrency were not strong enough to outweigh the operational cost.
Final position
The final position is narrower than the investigation looked at the start.
Performance in this system is controlled mainly by external I/O and by the structure of requests, not by raw JVM compute. CPU work inside the parser still matters, but only after keeping it in proportion. It matters because waste should not stay in the hot path, not because parser micro-optimizations define the runtime of the whole service.
What clearly mattered in this investigation was the sequence:
- string churn created avoidable CPU cost
- removing it exposed buffer growth
- removing buffer growth exposed direct byte processing
- cleaning that up made external wait impossible to ignore
That last step changed the interpretation of the whole system.
The parser became better in a local sense. The service became easier to understand. But the main performance boundary did not end up inside the parser implementation. It ended up at the edge of the system, where the service waits for something outside itself, accepts the cost of those waits, and deals with the consequences of trying to push them harder.
That is what controls performance here. Not the elegance of the parsing code on its own, and not the shape of one CPU flame graph, but the balance between request volume, response timing, concurrency, and long-run stability under external constraints.